Basic HTML Version
Table of Contents
View Full Version
Page 13 - Booklet_primary_2_first_term2026
P. 13
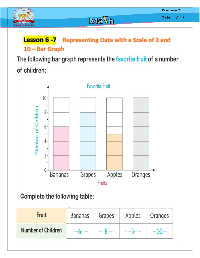
Lesson 6 -7 Representing Data with a Scale of 2 and

10 – Bar Graph

                                                              13
8
9
10
11
12
13
14
15
16
17
18