Page 17 - Optim Orthopedics
P. 17
Strategic processes and tools
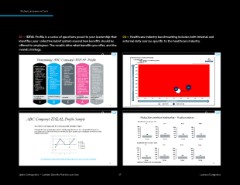
02 — IDEAL Proile is a series of questions posed to your leadership that 04 — Healthcare industry benchmarking includes both internal and
identiies your collective belief system around how beneits should be external data sources speciic to the healthcare industry.
offered to employees. The results drive what beneits you offer, and the
overall strategy.
Determining ABC Company’s IDEAL Profile Medical Plan Healthcare Industry Benchmarking
Book of Business Details:
Industry: Health Services (excluding Hospitals), Hospitals
Plan(s): PPO, HDHP
Enrollment Size: All
$1,000 Bubble size denotes enrollment volume
What is your view What is your Is controlling What is the Are your benefit $900
on promoting a philosophy costs the most employer’s role in offerings a
healthy employee toward important your employee’s differentiator or
population? financial security? not a differentiator $800
In addition to “benefits factor in What is your opinion from competitors?
traditional benefit equity” across delivering your on an employee’s Regarding the $700
packages, could employees? benefits choice of benefits? diverse needs of
employees benefit When strategy? your workforce, $600
from What is the Should an employer should employer s
nontraditional considering offer a plan that offer an array of
benefits (i.e., changes to your employer’s offers a broad range benefit plans that $500
voluntary company’s responsibility to of providers, a small meet employee HIGHER EMPLOYEE CONTRIBUTION ----->
benefits)? benefits, do you dependents? group of high- needs, pay for core $400
What is the consider EE performing benefits and
primary purpose disruption? providers, incents provide options $300 PPO
of offering health members to use for other needs, or HDHP
plans? high-performing stick to simple $200 Sample Client HDHP
providers (and limit
costs)? offerings? $100
EEs should be Benefits are a way to
ER should Influence Sensitive to Disrupting Economical Accountable for their create loyalty to $0
ee’s wellbeing ees 0.5 0.55 0.6 0.65 0.7 0.75 0.8 0.85 0.9 0.95 1
decisions company
I D E A L 1 Sample Client Plan RICHER PLAN BENEFITS ----->
Healthcare Benchmark
31 4 4
Pro\2019\LIPO LIfePoint\19Health Capabilities 23271.pptx
ABC Company’s IDEAL Profile Sample Medical plan contribution benchmarking – Healthcare industry
Avg. EMPLOYEE Share of Premium - PPO
EE EE+S EE+Ch Family
Your IDEAL scale aligns with the company profile of High D, High L. 100% 100% 100% 100%
80% 80%
Strategies that disrupt employees need to carefully weigh the reasons for a change with the impact on 80% 80%
your workforce. It is important that your benefits package is valued by your employees and enhances their 60% 60% 60% 60%
engagement at work. 40% 19% 40% 27% 40% 23% 40% 24%
20% 20% 20% 20%
0% 0% 0% 0%
Average Average Average Average
Avg. EMPLOYEE Share of Premium - QHDHP
EE EE+S EE+Ch Family
100% 100% 100% 100%
80% 80% 80% 80%
60% 60% 60% 60%
40% 40% 26% 40% 40% 25%
17% 22%
20% 20% 20% 20%
The belief system about how benefits should be offered can vary across your leadership. 0% 0% 0% 0%
Average Average Average Average
Healthcare industry with 500+ Employees
32 38
Optim Orthopedics — Lockton Beneits Practice overview 17 Lockton Companies