Page 24 - Change Healthcare
P. 24
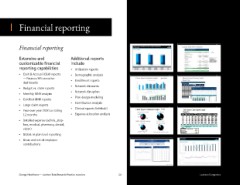
Financial reporting
Financial reporting Monthly Medical/Rx Projection
12-Month Renewal Projection
Self Funded Medical - Status Quo
PEPM Total Medical Total
Projected Lives (Nov-19) 3,707
Experience (Dec-18 - Nov-19)
Average Lagged Lives (1 Month) 3,772
$38,184,500
$843.71
Total Claims $833.66 $37,729,657
ISL Adjustments
-$10.05
-$454,843
Claims Net ISL Adjustments
Extensive and Additional reports Annual Trend $892.01 7.0% 7.0% 0.0% 14 $40,370,733 Note: Trend
assumptions take into
Trending Months
Effective Trend
account domestic
chargemaster increases
Trended Claims
annually and changes in
Claim Fluctuation Corridor
Plan Design Adjustment
customizable inancial include Projected Claims $892.01 1.0000 $40,370,733 domestic drug pricing
$30.07
$1,337,562
Administration Fees
Stop Loss Fees
$495,269
$11.13
$0.00
Estimated Rx Claims Savings
$0
reporting capabilities • Utilization reports 5 Projected Cost $933.22 $42,203,564 4
$901.15
Current Accrual
$40,084,594
% Change in Current Accrual
3.56%
$890.12
$39,593,962
Actual Cost
-1.22%
Actual Cost vs. Current Accrual
-$490,632
• Cash & Accrual (C&A) reports • Demographic analysis
— Finance/HR executive • Enrollment reports Claim report dashboard sample — quarterly Monthly Financial Reporting Sample
Medical /Rx
PEPM Cost vs Accrual
dashboards $800 $700 $600 $500 $470 $421 $576 $548 $561 $536 $515 $544 $658 $551 $446 $583 $728 $569 Sample Client Month Paid Claim Payments are Valued as of: (ASO and Stop Loss Paid Claims Large Claims 1 Total Paid Net Claims = Fixed + Claims (Monthly) Expected Plan Costs 2 Total Plan Costs (Cumulative) Expected Plan Costs 2
Medical and Rx Cash Flow Summary - (By Month Paid)
I.
November 30, 2019
Fixed Costs
Enrolled
Total Plan Costs
IIa.
Adjustments
Subscribers
= Fixed +
• Network discounts $400 $300 $200 January-18 February-18 March-18 April-18 May-18 June-18 3,762 3,749 3,743 3,730 3,737 3,753 Premium) $141,756 $141,228 $140,998 $140,651 $141,010 $141,575 $2,408,184 $2,350,989 $2,734,267 $2,430,645 $3,188,961 $2,838,492 $37,593 $253 Sample Self Funded Claim Report - Medical $2,512,347 $5,004,311 $7,879,575 $10,450,871 $13,780,842 $16,741,064 Claims $2,798,615 $5,585,742 $8,372,206 $11,156,468 $13,948,781 $16,751,884
$2,512,347
$2,798,615
$2,370,591
$2,350,736
$2,787,127
$2,491,964
$0
$2,786,464
$2,734,267
$2,875,265
$2,571,296
$2,784,263
$2,430,645
$0
• Budget vs. claim reports $100 $0 3Q17 $0 4Q17 $0 105% 1Q18 105% 2Q18 95% 3Q18 119% 4Q18 1Q19 77% 128% 2Q19 Cumulative (1/1/2018-18) 3,726 3,760 3,745 3,714 3,695 3,742 44,856 3,806 $140,651 $141,999 $141,493 $140,420 $139,583 $141,357 $1,692,721 $140,822 $2,625,621 $3,605,400 $2,549,164 $3,398,331 $2,314,924 $3,188,907 $33,633,884 $2,970,669 Plan Year Ending 12/31/19 Members Total 5,747 5,784 $34,384,213 $2,765,534 $3,525,080 $2,650,996 $3,047,477 $2,414,380 Admin Fee $3,239,682 $107,634 $108,437 $3,111,491 Specific Stop- $33,188 $33,420 $33,49
$2,792,313
$3,329,971
$3,188,961
$0
$2,818,647
$2,803,103
$19,845
$2,960,222
$2,785,631
July-18
$738
$2,624,883
$222,319
$2,810,564
$3,383,081
August-18
September-18
$2,509,503
$39,661
$2,803,528
$2,907,057
$491,274
October-18
Total Sub-
$40,127
$2,274,797
$2,781,392 Total Fixed
$30,694,426
November-18
Month/Year
$2,761,428
scribers
Claims
Loss Premium
($450k)
$90,583
$33,490,389
$2,795,963
December-18
$3,098,325
3,806
$33,490,389
$32,691,492
$0
$942,392
Jan-19
3,834
$0
$0 Feb-19
$3,205,023 $141,856
$2,970,669
January-19
• Network disruption PEPM Claims by Policy Period Quarter IIb. February-19 March-19 April-19 May-19 June-19 July-19 August-19 3,834 3,828 3,805 3,834 3,826 3,753 3,748 $141,856 $141,738 $140,848 $141,863 $141,598 $138,911 $138,830 $2,596,009 $2,723,194 $2,773,443 $3,604,519 $2,579,242 $2,954,615 $3,363,539 $2,741 Jul-19 $440 Aug-19 $40,121 Sep-19 $0 Mar-19 $0 Apr-19 $0 May-19 $0 Jun-19 $2,596,009 $2,723,194 $2,773,443 $3,604,519 $2,576,501 $2,954,176 $3,323,418 3,828 3,805 3,834 3,826 3,753 3,748 3,696 5,790 5,760 5,802 5,796 5,676 5,688 5,615
$3,205,023
Accrual
Cost
$3,231,924 $140,848
$3,211,094 $141,863
$3,231,374 $141,598
$3,225,183 $138,911
$3,161,773 $138,830
• Monthly IBNR analysis $700 $600 $500 $430 $465 $455 $493 $460 $502 Cumulative (1/1/2019-19) 3,696 3,690 3,707 41,528 $136,895 $136,718 $137,415 $1,537,496 $2,730,685 $3,139,786 $3,297,017 $32,732,717 ($3,074) v - 19 $219,239 $259,468 Average/Month No Dec-19 $32,473,249 $2,730,685 $3,142,859 $3,077,777 3,690 3,707 41,528 3,775 41,563 0 62,914 62,951 5,613 5,643 0 5,719 $1,174,401 $34,010,745 $104,342 $2,867,580 $104,828 $3,279,578 $3,215,192 $106,764 $28.30 $0 $32,376 $32,587 $363,095 $33,009 $0 $8.72 $3,120,375 $136,718 $1,537,496 $37.0
$3,164,750 $136,895
$0 Oct-19
September-19
$3,118,977 $137,415
October-19
$3,138,444
November-19
December-19
YTD Totals
$35,037,333 $139,772
Average/PEPM
Current Policy Year To Date
• Plan design modeling $400 $300 $200 $524 $478 $319 $312 $337 $316 $470 $343 $492 $477 $431 $574 $356 $639 III. Rolling 12 Months Actual vs Expected (Dec-18 to Nov-19) $93,126,066 $94,583,239 98% IV. Actual Plan Cost $4,000,000 $3,500,000 $3,000,000 $2,500,000 $2,000,000 Cautiously Optimistic $34,010,745 $35,037,333 97% V. Ind Stop Loss (ISL) Deductible Per Claimant $500,000 $259,468 Employee Contributions Sample Net Plan PEPM Comparison 96.4% $825 $856
Lagged Lives
Current Policy Year Stop Loss Summary
(Paid Basis)
(based on lagged enrollment)
Rolling Twelve Actual Plan Costs
Large Claims Adjustments
Expected Plan Costs
Rolling Twelve Expected Plan Costs
2019 YTD Actual
Percent of Expected
Percent of Expected
2019 YTD Budget
$421
Actual vs. Budget
• Certiied IBNR reports $100 $0 4Q15 1Q16 2Q16 3Q16 4Q16 $108 1Q17 PEPM Claims 2Q17 3Q17 12-mo Average 1Q18 2Q18 3Q18 4Q18 1Q19 2Q19 1 $1,500,000 $1,000,000 $500,000 $0 Jan-19 Feb-19 Mar-19 Apr-19 May-19 Jun-19 Jul-19 Aug-19 Sep-19 Oct-19 Nov-19 Dec-19 Cost Total Accrual 2018 Actual 104.0% 12.6% $780 $750 6.5% 5
2018 Budget
Actual vs. Budget
4Q17
2019 vs. 2018 Actual
2019 vs. 2018 Budget
• Contribution analysis
• Large claim reports
• Clinical reports (Infolock) Claim Report Dashboard Sample - YTD Self Insured Claim Report Sample
• Year-over-year (YOY) or rolling YTD Gross Plan Cost - Detailed YTD Net Plan Cost Medical/Rx
$285,671 , 10%
Stop-Loss
12 months • Expense allocation analysis $176,751 , 7% $416,152 , Month/Year Subscribers Members Admin Fee Specific Stop- Total Fixed Gross Medical Gross Rx Claims Reimbursable Net Paid Claims Total Net
Total
Total
Loss
Plan Cost
Claims
Premium
Claims ($175k)
16%
$2,254,931
$724,894
Jan-19
$93,362
$3,299,858
$2,979,824
2,405
$226,671
$0
$320,033
5,471
$554,633 ,
Feb-19
$3,241,591
$688
$2,923,154
$318,437
20% $1,741,420 , Mar-19 2,384 2,393 5,423 5,424 $92,547 $224,692 $317,239 $2,004,489 $703,886 $20,317 $2,688,058 $3,005,297
$777,111
$2,146,731
$225,540
$92,896
Apr-19
63% $2,253,951 , May-19 2,392 2,391 2,384 5,445 5,419 5,406 $92,857 $225,446 $318,303 $2,478,921 $855,677 $386,407 $2,948,190 $3,266,494
$898,619
$318,170
$92,819
$221,631
$2,934,763
$2,257,775
$225,352
$3,252,934
84%
$2,741,870
$224,692
$317,239
$2,424,631
Jun-19
$876,056
$2,216,474
$92,547
• Detailed expense (admin., stop- Medical Claims Rx Claims Admin Stop Loss Premium Net Paid Claims Total Fixed Aug-19 2,396 2,382 2,393 2,430 5,456 5,421 5,442 5,492 $93,013 $225,823 $318,836 $2,090,771 $882,345 $388,500 $2,584,616 $2,903,452
$667,899
Jul-19
$469,760
$2,544,848
$3,276,385
$884,324
$316,973
$2,959,412
$92,469
$224,504
$225,540
$318,437
$381,438
$92,896
$3,118,959
$2,630,017
Sep-19
$3,437,396
$870,380
$94,333
$2,480,808
$2,804,168
$323,360
$939,423
$229,028
$447,031
$1,988,416
Oct-19
$904,933
Dec-19
$641,403
$2,610,313
YTD Claims YTD Claims Distribution Nov-19 2,422 2,419 5,468 5,460 $94,022 $228,274 $322,296 $1,807,660 $821,998 $84,968 $2,544,691 $2,866,986
$3,195,739
$2,873,843
$227,991
$321,896
$93,906
loss, medical, pharmacy, dental, $554,633 , $- , 0%- , 0% 4% 2% 8% Average/Month 28,791 65,327 $1,117,667 $2,713,552 $3,831,218 $27,031,348 $10,139,645 $3,710,042 $33,460,951 $37,292,169
YTD Totals
$
24%
$226,129
$2,252,612
$3,107,681
5,444
2,399
$93,139
$844,970
$319,268.20
$309,170
$2,788,413
Average/PEPM
Lagged Lives 28,668 65,051 $38.82 $94.25 $133.07 $942.91 $353.69 $129.41 $1,167.19 $1,300.26
vision) $1,741,420 , PEPM Comparison $1,300.26
YTD Total PEPM (based on lagged enrollment)
2018 Total PEPM
$1,249.35
76%
86%
Gross Medical Claims Gross Rx Claims <$25,000 $25,000 - $50,000 $50,000 - $100,000 $100,000+ 2019 vs. 2018 Change 4.1%
HRA Claims Runout 2 2019 Budget PEPM $1,392.08 6
-6.6%
2019 Actual vs. Budget
• Global or plan level reporting
Claims Trending
• Gross and net of employee Incurred But Not Paid Health Plan Reserve as of Self Funded Medical
SAMPLE
3/31/2020
Benefit 3/31/2020 PEPM Claims by Policy Period Quarter PEPM Claims 12-Month Average $780 $790 $790
contributions Margin: 5%: $308,000 $800 $700 $600 $650 $680 $710 $730 $730
$900
Medical/Rx
$6,163,200
Total
$6,471,200
SAMPLE
SAMPLE
3/31/2020
Incurred But Not Reported Health Plan Reserve as of Incurred But Not Reported Health Plan Reserve as of $500 $400
3/31/2020 Month Covered Employees Covered Members Incurred Claims Paid to Completion Factor Total Incurred Claims IBNR Estimate
Date (Med/Rx)
Estimate (Med/Rx)
SAMPLE Medical/Rx Historical and Projected IBNR Apr-17 7,478 11,581 11,350 $4,569,418 $4,715,902 100.0% 100.0% $4,569,418 $4,715,902 $0 $0 $300
May-17
7,419
7,395
$10,000,000 Jun-17 7,479 11,419 11,307 $4,560,988 $4,630,174 100.0% 100.0% $4,560,988 $4,630,174 $0 $0 $200
Jul-17
Aug-17 7,366 11,278 $6,074,250 100.0% $6,074,250 $0 $65
7,375
Oct-17
$9,000,000 Sep-17 7,353 11,245 11,292 $5,582,412 $5,623,838 100.0% 100.0% $5,582,412 $5,623,838 $0 $0 $100
Nov-17 7,347 11,246 11,439 $4,794,087 $5,246,241 100.0% 100.0% $4,794,087 $5,246,241 $0 $0 $0
Dec-17
7,484
$8,000,000 Jan-18 7,523 11,358 11,307 $4,754,629 $4,868,310 100.0% 100.0% $4,754,629 $4,868,310 $0 $0 1Q17 2Q17 3Q17 4Q17 1Q18 2Q18 3Q18 4Q18 1Q19 2Q19 3Q19 4Q19
Feb-18
7,498
Mar-18 7,486 11,308 $5,511,525 100.0% $5,511,525 $0
7,474
May-18
$7,000,000 Apr-18 7,459 11,323 11,359 $5,624,135 $6,007,548 100.0% 100.0% $5,624,267 $6,008,050 $133 $501
Jun-18 7,506 11,406 $5,900,727 100.0% $5,901,319 $592
Aug-18
$6,000,000 Jul-18 7,453 11,347 11,449 $5,927,124 $6,031,535 100.0% 100.0% $5,927,899 $6,032,507 $775 $973 PEPM COST VS ACCRUAL
7,520
Sep-18 7,490 11,403 11,314 $5,424,790 $5,553,954 100.0% 100.0% $5,425,876 $5,554,691 $1,087 $738
Oct-18
7,428
$5,000,000 Nov-18 7,390 11,208 11,360 $6,099,789 $5,264,843 100.0% 100.0% $6,101,171 $5,267,119 $1,382 $2,276 Cost Accrual
Dec-18
7,484
Jan-19 7,612 11,494 $5,622,647 99.9% $5,626,413 $3,765
$4,000,000 Feb-19 7,669 11,567 11,581 $5,231,368 $5,324,577 99.9% 99.9% $5,237,800 $5,330,019 $6,432 $5,442
7,657
Mar-19
Apr-19 7,610 11,519 $6,228,629 99.9% $6,235,891 $7,262 $1,000
7,652
Jun-19
$3,000,000 May-19 7,668 11,603 11,593 $5,444,632 $5,801,540 99.8% 99.7% $5,456,161 $5,820,076 $11,529 $18,536 $900
Jul-19 7,506 11,352 $6,681,959 99.6% $6,711,023 $29,064
$2,000,000 Aug-19 7,497 11,375 11,230 $6,007,219 $5,831,584 99.4% 99.1% $6,043,753 $5,882,077 $36,533 $50,493 $800
Sep-19
7,392
Oct-19 7,379 11,226 11,286 $6,335,851 $5,525,853 98.6% 98.2% $6,428,475 $5,625,509 $92,624 $99,657 $700
Nov-19
7,414
$1,000,000 Dec-19 7,575 11,505 11,520 $5,860,768 $5,153,306 96.8% 94.2% $6,052,870 $5,471,980 $192,102 $318,673 $600
Jan-20
7,680
Feb-20 7,686 11,590 $4,798,904 83.3% $5,758,089 $959,185
-
$0 Mar-20 7,680 11,560 - $1,725,983 $0 28.5% $6,049,819 $0 $4,323,836 $0 $500
Total - $194,341,036 $200,504,625 $6,163,589 $400
-
Estimated Outstanding Medical/Rx Liability at 03/31/20: $6,163,589 $300
Historical IBNR Projected IBNR Estimated Outstanding Medical/Rx Liability at 03/31/20 Including Margin: Margin: 5%: $308,000 $6,471,768 $200
$100
$0
LOCKTON COMPANIES | 1
8
Change Healthcare — Lockton Total Rewards Practice overview 24 Lockton Companies