Page 25 - SuperShuttle
P. 25
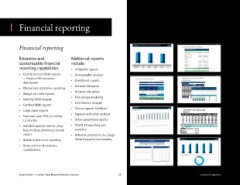
Financial reporting
Financial reporting Expected Accrual Assessment by Total Summary (Total Medical) Monthly Medical/Rx Projection
Self Funded Medical
Total Cost vs Expected Accrual
12-Month Renewal Projection
$46,500,000 $48,000,000 $44,000,000 Self Funded Medical - Status Quo Total Medical
$43,000,000 $42,000,000 $41,500,000 Projected Lives (Nov-19) PEPM 3,707 Total
Experience (Dec-18 - Nov-19)
Average Lagged Lives (1 Month) 3,772
Total Claims $833.66 $37,729,657
$38,184,500
$843.71
-$454,843
-$10.05
ISL Adjustments
Claims Net ISL Adjustments
Extensive and Additional reports 97% 102% 101% Annual Trend $892.01 7.0% 7.0% 0.0% 14 $40,370,733
Trending Months
Effective Trend
Trended Claims
Claim Fluctuation Corridor
customizable inancial include Total Medical Summary Lives Total Cost Jan-18 to Dec-18 Accrual Var ($) Jan-17 to Dec-17 % Projected Claims $892.01 1.0000 $40,370,733
Plan Design Adjustment
Jan-19 to Nov-19
$1,337,562
$30.07
Administration Fees
$495,269
Stop Loss Fees
$11.13
$0.00
$0
Estimated Rx Claims Savings
$1,500,000
reporting capabilities • Utilization reports Jan-19 to Nov-19 103,819 $46,500,000 $48,000,000 ($1,000,000) 102% 97% Projected Cost $933.22 $42,203,564 1
Jan-18 to Dec-18
$44,000,000
112,140
$43,000,000
Current Accrual
$40,084,594
$901.15
Jan-17 to Dec-17
$42,000,000
$41,500,000
111,429
101%
($500,000)
3.56%
% Change in Current Accrual
$39,593,962
$890.12
Actual Cost
-$490,632
Actual Cost vs. Current Accrual
-1.22%
10
• Cash & Accrual (C&A) reports • Demographic analysis
— Finance/HR executive • Enrollment reports Large claim distribution analysis Monthly Financial Reporting Sample
Medical /Rx
dashboards Large Claim Distribution - Annual Sample Client Month Paid Claim Payments are Valued as of: (ASO and Stop Loss Paid Claims Large Claims 1 Total Paid Net Claims = Fixed + Claims (Monthly) Expected Plan Costs 2 Total Plan Costs (Cumulative) Expected Plan Costs 2
Sample Client
Medical and Rx Cash Flow Summary - (By Month Paid)
I.
November 30, 2019
Fixed Costs
Enrolled
IIa.
Total Plan Costs
Subscribers
= Fixed +
• Network discounts Plan Year 2018 2019 Actuarial Norm - January-18 February-18 March-18 April-18 May-18 June-18 3,762 3,749 3,743 3,730 3,737 3,753 Premium) $141,756 $141,228 $140,998 $140,651 $141,010 $141,575 $2,408,184 $2,350,989 $2,734,267 $2,430,645 $3,188,961 $2,838,492 $37,593 $253 Sample Self Funded Claim Report - Medical $2,512,347 $5,004,311 $7,879,575 $10,450,871 $13,780,842 $16,741,064 Claims $2,798,615 $5,585,742 $8,372,206 $11,156,468 $13,948,781 $16,751,884
Adjustments
$2,798,615
$2,370,591
$2,512,347
$2,787,127
$2,491,964
$2,350,736
$2,875,265
$2,734,267
$0
$2,786,464
$2,571,296
$2,430,645
$2,784,263
$0
$2,792,313
$3,329,971
Expected Annual
• Clinical and utilization reporting Average Employees Count 18,612 Average Cost Count 19,525 Average Cost Count 19,525 Average Cost Cumulative (1/1/2018-18) 3,726 3,760 3,745 3,714 3,695 3,742 44,856 3,806 $140,651 $141,999 $141,493 $140,420 $139,583 $141,357 $1,692,721 $140,822 $2,625,621 $3,605,400 $2,549,164 $3,398,331 $2,314,924 $3,188,907 $33,633,884 $2,970,669 Plan Year Ending 12/31/19 Members Total 5,747 5,784 $34,384,213 $2,765,534 $3,525,080 $2,650,996 $3,047,477 $2,414,380 Admin Fee $3,239,682 $107,634 $108,437 $3,111,491 Specific Stop- $33,188
$0
$3,188,961
$2,803,103
$19,845
$2,818,647
$2,960,222
$2,624,883
Average Members
$2,785,631
$738
July-18
$3,383,081
August-18
$222,319
$2,810,564
$2,803,528
$39,661
September-18
$2,509,503
October-18
10,635
$2,907,057
10,007
10,635
$491,274
Total Sub-
$40,127
Month/Year
November-18
$2,781,392 Total Fixed
$2,761,428
$2,274,797
Claims
scribers
Loss Premium
($450k)
$33,490,389
$2,795,963
$90,583
$3,098,325
December-18
Frequency/Severity
Jan-19
$942,392
3,806
$33,490,389
$32,691,492
$0
$0
3,834
$3,205,023 $141,856
$0 Feb-19
$2,970,669
January-19
$3,205,023
• Network disruption $125k - $150k 30 22 13 11 $135,913 22 15 20 13 $134,996 24.8 17.0 11.2 14.8 $136,788 IIb. February-19 March-19 April-19 May-19 June-19 July-19 August-19 3,834 3,828 3,805 3,834 3,826 3,753 3,748 $141,856 $141,738 $140,848 $141,863 $141,598 $138,911 $138,830 $2,596,009 $2,723,194 $2,773,443 $3,604,519 $2,579,242 $2,954,615 $3,363,539 $2,741 Jul-19 $440 Aug-19 $40,121 Sep-19 $0 Mar-19 $0 Apr-19 $0 May-19 $0 Jun-19 $2,596,009 $2,723,194 $2,773,443 $3,604,519 $2,576,501 $2,954,176 $3,323,418 3,828 3,805 3,834 3,826 3,753 3,
$159,440
$150k - $175k
$161,632
$162,430
$3,231,924 $140,848
$3,211,094 $141,863
$186,198
$187,746
$3,231,374 $141,598
$186,695
$175k - $200k
$3,225,183 $138,911
$3,161,773 $138,830
$200k - $250k
$213,335
$222,856
• Budget vs. claim reports Membership Adjusted 90.3 22 98 $496,851 37 107 94.7 $273,870 27.0 94.7 $439,674 Cumulative (1/1/2019-19) 3,696 3,690 3,707 41,528 $136,895 $136,718 $137,415 $1,537,496 $2,730,685 $3,139,786 $3,297,017 $32,732,717 ($3,074) v - 19 $219,239 Average/Month No Dec-19 $32,473,249 $2,730,685 $3,142,859 $3,077,777 3,690 3,707 41,528 3,775 41,563 0 62,914 62,951 5,613 5,643 0 5,719 $1,174,401 $34,010,745 $104,342 $2,867,580 $104,828 $3,279,578 $3,215,192 $106,764 $28.30 $0 $32,376 $32,587 $363,095 $33,009 $0 $8.72 $3,120,375 $1
$222,076
$3,164,750 $136,895
$0 Oct-19
$468,150
$250k+
September-19
$3,118,977 $137,415
October-19
November-19
$3,138,444
Grand Totals
$246,780
$238,459
December-19
YTD Totals
$246,780
$259,468
$35,037,333 $139,772
$246,780
Average/PEPM
Norms
• Plan design modeling # of Claimants > $100k per $23,369,000 $29,304,000 $23,373,000 III. Rolling 12 Months Actual vs Expected (Dec-18 to Nov-19) $93,126,066 $94,583,239 98% IV. Actual Plan Cost $4,000,000 $3,500,000 $3,000,000 $2,500,000 $2,000,000 Cautiously Optimistic $34,010,745 $35,037,333 97% V. Ind Stop Loss (ISL) Deductible Per Claimant $500,000 $259,468 Employee Contributions Sample Net Plan PEPM Comparison 96.4% $825 $856
Lagged Lives
Current Policy Year To Date
5.3
4.9
(Paid Basis)
Current Policy Year Stop Loss Summary
5.5
1,000 Members
(based on lagged enrollment)
Rolling Twelve Actual Plan Costs
Rolling Twelve Expected Plan Costs
Expected Plan Costs
Large Claims Adjustments
Percent of Expected
2019 YTD Actual
Total Large Claims >$125k
Percent of Expected
2019 YTD Budget
Actual vs. Budget
• Monthly IBNR analysis PEPM Large Claims $195 $230 $183 1 $1,500,000 $1,000,000 $500,000 $0 Jan-19 Feb-19 Mar-19 Apr-19 May-19 Jun-19 Jul-19 Aug-19 Sep-19 Oct-19 Nov-19 Dec-19 Cost Total Accrual 2018 Actual 104.0% 12.6% $780 $750 6.5% 5
2018 Budget
Actual vs. Budget
2019 vs. 2018 Actual
2019 vs. 2018 Budget
• Contribution analysis
• Certiied IBNR reports Claims Trending
• Clinical reports (Infolock) Self Funded Medical Self Insured Claim Report Sample
• Large claim reports PEPM Claims by Policy Period Quarter PEPM Claims $710 $730 12-Month Average $780 $730 $790 $790 Medical/Rx
$900
$800
• Expense allocation analysis $700 $600 $500 $650 $680 Month/Year Subscribers Members Admin Fee Specific Stop- Total Fixed Gross Medical Gross Rx Claims Reimbursable Net Paid Claims Total Net
Stop-Loss
Total
Total
Loss
Claims
Plan Cost
Claims ($175k)
Premium
• Year-over-year (YOY) or rolling $400 $300 $200 $100 $65 Mar-19 2,405 2,384 2,393 2,392 2,391 5,471 5,423 5,424 5,445 5,419 $93,362 $226,671 $320,033 $2,254,931 $724,894 $20,317 $0 $2,979,824 $3,299,858
Jan-19
$703,886
$224,692
Feb-19
$317,239
$3,005,297
$2,004,489
$92,547
$2,688,058
$688
$92,896
$318,437
$3,241,591
$2,146,731
$225,540
$2,923,154
$777,111
$2,948,190
Apr-19
$3,266,494
$386,407
$2,478,921
$855,677
$318,303
$225,446
$92,857
$898,619
$3,252,934
$2,257,775
$221,631
May-19
$225,352
$92,819
$318,170
$2,934,763
Jun-19
$0
12 months • Other customized reports PEPM COST VS ACCRUAL 1Q17 2Q17 3Q17 4Q17 1Q18 2Q18 3Q18 4Q18 1Q19 2Q19 3Q19 4Q19 Aug-19 2,384 2,396 2,382 2,393 2,430 5,406 5,456 5,421 5,442 5,492 $92,547 $224,692 $317,239 $2,216,474 $876,056 $667,899 $2,424,631 $2,741,870
$2,903,452
$318,836
$882,345
$225,823
$93,013
$388,500
Jul-19
$2,090,771
$2,584,616
$224,504
$2,959,412
$316,973
$3,276,385
$469,760
$2,544,848
$92,469
$884,324
$318,437
$3,118,959
Sep-19
$870,380
$3,437,396
$2,630,017
$225,540
$381,438
$92,896
$2,804,168
$323,360
$1,988,416
$939,423
$447,031
$2,480,808
$94,333
Oct-19
$229,028
$322,296
Nov-19
$228,274
$821,998
$94,022
$2,866,986
$1,807,660
$84,968
$2,544,691
$2,610,313
$904,933
$93,906
$3,195,739
Cost Accrual YTD Totals 2,422 2,419 28,791 5,468 5,460 65,327 $1,117,667 $2,713,552 $3,831,218 $27,031,348 $10,139,645 $3,710,042 $33,460,951 $37,292,169
Dec-19
$2,873,843
$321,896
$227,991
$641,403
$1,000
• Detailed expense (admin., stop- • COVID-19 reporting and $800 $700 $600 $500 $400 PEPM Comparison 2,399 28,668 5,444 65,051 $93,139 $226,129 $319,268.20 $2,252,612 $844,970 $309,170 $2,788,413 $3,107,681
$900
Average/Month
$1,167.19
$1,300.26
$38.82
Average/PEPM
$942.91
$353.69
$133.07
$94.25
$129.41
Lagged Lives
loss, medical, pharmacy, dental, analytics $300 $200 $100 $0 YTD Total PEPM (based on lagged enrollment) $1,300.26
$1,249.35
2018 Total PEPM
4.1%
2019 vs. 2018 Change
2019 Budget PEPM $1,392.08 6
-6.6%
2019 Actual vs. Budget
vision) • Actuarial projections, i.e., large 8
• Global or plan level reporting claim frequency and severity Incurred But Not Paid Health Plan Reserve as of Executive Overview
Self Funded Medical
SAMPLE
PEPM Cost vs Accrual
3/31/2020
Benefit 3/31/2020 $843.25 $879.33
Medical/Rx Total $6,163,200 $780.11 $747.79 $765.31 $842.75 $817.89 $832.28 $843.65 $846.01
$308,000
Margin: 5%:
• Gross and net of employee SAMPLE Incurred But Not Reported Health Plan Reserve as of
$6,471,200
SAMPLE
Incurred But Not Reported Health Plan Reserve as of
3/31/2020 Month Apr-17 7,478 11,581 11,350 11,419 Incurred Claims Paid to 3/31/2020 $4,569,418 $4,715,902 $4,560,988 Completion Factor 100.0% 100.0% 100.0% Total Incurred Claims $4,569,418 $4,715,902 $4,560,988 IBNR Estimate $0 $0 $0
Covered Members
Covered Employees
Estimate (Med/Rx)
Date (Med/Rx)
SAMPLE Medical/Rx Historical and Projected IBNR
7,419
May-17
contributions $10,000,000 $9,000,000 $8,000,000 Jul-17 7,395 11,307 11,278 11,245 11,292 11,246 11,439 11,358 11,307 $4,630,174 $6,074,250 $5,582,412 $5,623,838 $4,794,087 $5,246,241 $4,754,629 $4,868,310 100.0% 100.0% 100.0% 100.0% 100.0% 100.0% 100.0% 100.0% $4,630,174 $6,074,250 $5,582,412 $5,623,838 $4,794,087 $5,246,241 $4,754,629 $4,868,310 $0 $0 $0 $0 $0 $0 $0 $0
Jun-17
7,479
7,366
Aug-17
7,353
Sep-17
Oct-17
7,375
7,347
Nov-17
7,484
Dec-17
Jan-18
7,523
Feb-18
7,498
7,459
Apr-18
$7,000,000 Mar-18 7,486 11,308 11,323 11,359 $5,511,525 $5,624,135 $6,007,548 100.0% 100.0% 100.0% $5,511,525 $5,624,267 $6,008,050 $133 $501 $0 104% 91% 97% 99% 104%
May-18
7,474
Jun-18 7,506 11,406 $5,900,727 100.0% $5,901,319 $592
$6,000,000 Jul-18 7,453 11,347 11,449 $5,927,124 $6,031,535 100.0% 100.0% $5,927,899 $6,032,507 $775 $973
7,520
Aug-18
Sep-18 7,490 11,403 11,314 $5,424,790 $5,553,954 100.0% 100.0% $5,425,876 $5,554,691 $1,087 $738 4Q18 1Q19 2Q19 3Q19 4Q19
Oct-18
7,428
$5,000,000 Nov-18 7,390 11,208 11,360 $6,099,789 $5,264,843 100.0% 100.0% $6,101,171 $5,267,119 $1,382 $2,276
Dec-18
7,484
Jan-19 7,612 11,494 $5,622,647 99.9% $5,626,413 $3,765
Mar-19
$4,000,000 Feb-19 7,669 11,567 11,581 $5,231,368 $5,324,577 99.9% 99.9% $5,237,800 $5,330,019 $6,432 $5,442 Policy Period Claims by Band $250,000 - $449,999 $450,000+ 4.1%
7,657
Apr-19 7,610 11,519 $6,228,629 99.9% $6,235,891 $7,262 5.1%
Jun-19
$3,000,000 May-19 7,668 11,603 11,593 $5,444,632 $5,801,540 99.8% 99.7% $5,456,161 $5,820,076 $11,529 $18,536 $150,000 - $249,999
7,652
Jul-19 7,506 11,352 $6,681,959 99.6% $6,711,023 $29,064
7,392
Sep-19
$2,000,000 Aug-19 7,497 11,375 11,230 $6,007,219 $5,831,584 99.4% 99.1% $6,043,753 $5,882,077 $36,533 $50,493 7.0%
Oct-19 7,379 11,226 11,286 $6,335,851 $5,525,853 98.6% 98.2% $6,428,475 $5,625,509 $92,624 $99,657
7,414
Nov-19
$1,000,000 Dec-19 7,575 11,505 11,520 $5,860,768 $5,153,306 96.8% 94.2% $6,052,870 $5,471,980 $192,102 $318,673
Jan-20
7,680
Feb-20 7,686 11,590 $4,798,904 83.3% $5,758,089 $959,185
$0 Mar-20 7,680 11,560 - $1,725,983 $0 28.5% $6,049,819 $0 $4,323,836 $0
-
Total - $194,341,036 $200,504,625 $6,163,589
-
Estimated Outstanding Medical/Rx Liability at 03/31/20: $6,163,589
Historical IBNR Projected IBNR Estimated Outstanding Medical/Rx Liability at 03/31/20 Including Margin: Margin: 5%: $308,000 $6,471,768
<$150,000
LOCKTON COMPANIES | 1 83.8%
7
SuperShuttle — Lockton Total Rewards Practice overview 25 Lockton Companies