
Page 100 - SALIK PR REPORT MAY 2024
P. 100
5/14/24, 10:47 AM Salik Achieves Record Revenue and Profit Growth in Q1 2024
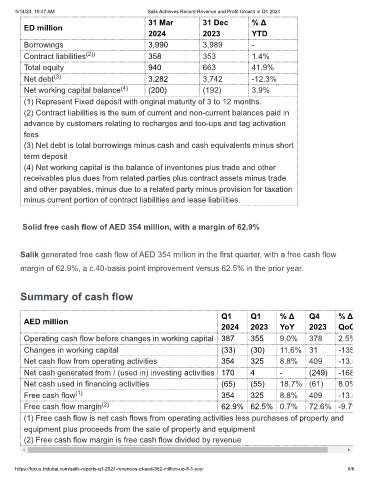
31 Mar 31 Dec % Δ
ED million
2024 2023 YTD
Borrowings 3,990 3,989 -
Contract liabilities (2)) 358 353 1.4%
Total equity 940 663 41.9%
Net debt (3) 3,282 3,742 -12.3%
Net working capital balance (4) (200) (192) 3.9%
(1) Represent Fixed deposit with original maturity of 3 to 12 months.
(2) Contract liabilities is the sum of current and non-current balances paid in
advance by customers relating to recharges and too-ups and tag activation
fees
(3) Net debt is total borrowings minus cash and cash equivalents minus short
term deposit
(4) Net working capital is the balance of inventories plus trade and other
receivables plus dues from related parties plus contract assets minus trade
and other payables, minus due to a related party minus provision for taxation
minus current portion of contract liabilities and lease liabilities.
Solid free cash flow of AED 354 million, with a margin of 62.9%
Salik generated free cash flow of AED 354 million in the first quarter, with a free cash flow
margin of 62.9%, a c.40-basis point improvement versus 62.5% in the prior year.
Summary of cash flow
Q1 Q1 % Δ Q4 % Δ
AED million
2024 2023 YoY 2023 QoQ
Operating cash flow before changes in working capital 387 355 9.0% 378 2.5%
Changes in working capital (33) (30) 11.6% 31 -135
Net cash flow from operating activities 354 325 8.8% 409 -13.5
Net cash generated from / (used in) investing activities 170 4 - (249) -168
Net cash used in financing activities (65) (55) 18.7% (61) 8.0%
Free cash flow (1) 354 325 8.8% 409 -13.5
Free cash flow margin (2) 62.9% 62.5% 0.7% 72.6% -9.7%
(1) Free cash flow is net cash flows from operating activities less purchases of property and
equipment plus proceeds from the sale of property and equipment
(2) Free cash flow margin is free cash flow divided by revenue
https://focus.hidubai.com/salik-reports-q1-2024-revenues-of-aed-562-million-up-8-1-yoy/ 6/8