
Page 372 - Foundations of Marketing
P. 372
Pricing Concepts and Management | Chapter 12 339
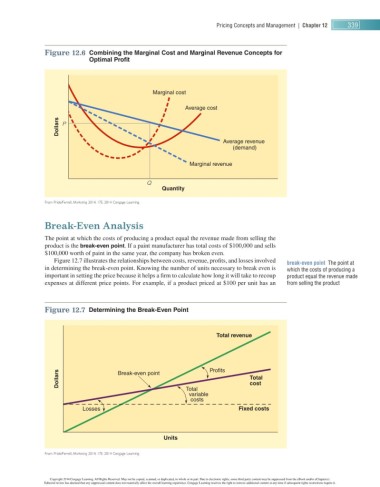
Figure 12.6 Combining the Marginal Cost and Marginal Revenue Concepts for
Optimal Profi t
Marginal cost
Average cost
Dollars P
Average revenue
(demand)
Marginal revenue
Q
Quantity
From Pride/ Ferrell , Marketing 2014, 17E. 2014 Cengage Learning.
Break-Even Analysis
The point at which the costs of producing a product equal the revenue made from selling the
product is the break-even point . If a paint manufacturer has total costs of $ 100,000 and sells
$ 100,000 worth of paint in the same year, the company has broken even.
Figure 12.7 illustrates the relationships between costs, revenue, profi ts, and losses involved break-even point The point at
in determining the break-even point. Knowing the number of units necessary to break even is which the costs of producing a
important in setting the price because it helps a fi rm to calculate how long it will take to recoup product equal the revenue made
expenses at different price points. For example, if a product priced at $ 100 per unit has an from selling the product
Figure 12.7 Determining the Break-Even Point
Total revenue
Dollars Break-even point Profits Total
cost
Total
variable
costs
Losses Fixed costs
Units
From Pride/ Ferrell , Marketing 2014, 17E. 2014 Cengage Learning.
Copyright 2014 Cengage Learning. All Rights Reserved. May not be copied, scanned, or duplicated, in whole or in part. Due to electronic rights, some third party content may be suppressed from the eBook and/or eChapter(s).
Editorial review has deemed that any suppressed content does not materially affect the overall learning experience. Cengage Learning reserves the right to remove additional content at any time if subsequent rights restrictions require it.