
Page 20 - August-2020-Issue
P. 20
ARTICLE
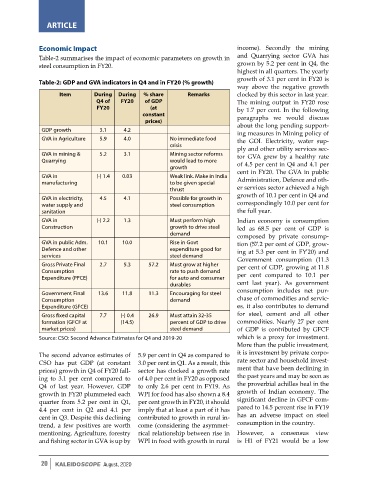
Economic Impact income). Secondly the mining
Table-2 summarises the impact of economic parameters on growth in and Quarrying sector GVA has
steel consumption in FY20. grown by 5.2 per cent in Q4, the
highest in all quarters. The yearly
growth of 3.1 per cent in FY20 is
Table-2: GDP and GVA indicators in Q4 and in FY20 (% growth)
way above the negative growth
Item During During % share Remarks clocked by this sector in last year.
Q4 of FY20 of GDP The mining output in FY20 rose
FY20 (at by 1.7 per cent. In the following
constant paragraphs we would discuss
prices)
GDP growth 3.1 4.2 about the long pending support-
ing measures in Mining policy of
GVA in Agriculture 5.9 4.0 No immediate food the GOI. Electricity, water sup-
crisis ply and other utility services sec-
GVA in mining & 5.2 3.1 Mining sector reforms tor GVA grew by a healthy rate
Quarrying would lead to more of 4.5 per cent in Q4 and 4.1 per
growth
GVA in (-) 1.4 0.03 Weak link. Make in India cent in FY20. The GVA in public
Administration, Defence and oth-
manufacturing to be given special
thrust er services sector achieved a high
growth of 10.1 per cent in Q4 and
GVA in electricity, 4.5 4.1 Possible for growth in
water supply and steel consumption correspondingly 10.0 per cent for
sanitation the full year.
GVA in (-) 2.2 1.3 Must perform high Indian economy is consumption
Construction growth to drive steel led as 68.5 per cent of GDP is
demand composed by private consump-
GVA in public Adm. 10.1 10.0 Rise in Govt tion (57.2 per cent of GDP, grow-
Defence and other expenditure good for ing at 5.3 per cent in FY’20) and
services steel demand
Government consumption (11.3
Gross Private Final 2.7 5.3 57.2 Must grow at higher per cent of GDP, growing at 11.8
Consumption rate to push demand
Expenditure (PFCE) for auto and consumer per cent compared to 10.1 per
durables cent last year). As government
Government Final 13.6 11.8 11.3 Encouraging for steel consumption includes net pur-
Consumption demand chase of commodities and servic-
Expenditure (GFCE) es, it also contributes to demand
Gross fixed capital 7.7 (-) 0.4 26.9 Must attain 32-35 for steel, cement and all other
formation (GFCF at (14.5) percent of GDP to drive commodities. Nearly 27 per cent
market prices) steel demand of GDP is contributed by GFCF
Source: CSO: Second Advance Estimates for Q4 and 2019-20 which is a proxy for investment.
More than the public investment,
The second advance estimates of 5.9 per cent in Q4 as compared to it is investment by private corpo-
CSO has put GDP (at constant 3.0 per cent in Q1. As a result, this rate sector and household invest-
prices) growth in Q4 of FY20 fall- sector has clocked a growth rate ment that have been declining in
ing to 3.1 per cent compared to of 4.0 per cent in FY20 as opposed the past years and may be seen as
Q4 of last year. However, GDP to only 2.6 per cent in FY19. As the proverbial achilles heal in the
growth in FY20 plummeted each WPI for food has also shown a 8.4 growth of Indian economy. The
quarter from 5.2 per cent in Q1, per cent growth in FY20, it should significant decline in GFCF com-
4.4 per cent in Q2 and 4.1 per imply that at least a part of it has pared to 14.5 percent rise in FY19
cent in Q3. Despite this declining contributed to growth in rural in- has an adverse impact on steel
trend, a few positives are worth come (considering the asymmet- consumption in the country.
mentioning. Agriculture, forestry rical relationship between rise in However, a consensus view
and fishing sector in GVA is up by WPI in food with growth in rural is H1 of FY21 would be a low
20 KaleidOscope August, 2020