
Page 127 - Caribbean-Central America Profile 2018
P. 127
ST. LUCIA
CARIBBEAN-CENTRAL AMERICA PROFILE 2018
The types of involvement could be: Country Profile
• Equity partnership or total investment 1990 2000 2010 2016
• Joint ventures World view
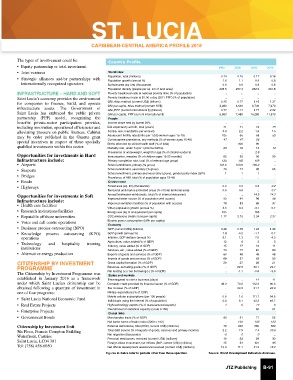
• Strategic alliances and/or partnerships with Population, total (millions) 0.14 0.16 0.17 0.18
internationally recognized operators Population growth (annual %) 1.6 1.1 0.9 0.5
Surface area (sq. km) (thousands)
0.6
0.6
0.6
0.6
Population density (people per sq. km of land area) 226.5 257.3 282.9 291.8
INFRASTRUCTURE – HARD AND SOFT Poverty headcount ratio at national poverty lines (% of population) .. .. .. ..
Saint Lucia’s economy provides the environment Poverty headcount ratio at $1.90 a day (2011 PPP) (% of population) .. .. .. ..
for companies to finance, build, and operate GNI, Atlas method (current US$) (billions) 0.45 0.72 1.16 1.37
infrastructure assets. The Government of GNI per capita, Atlas method (current US$) 3,280 4,620 6,740 7,670
0.77
1.17
GNI, PPP (current international $) (billions)
2.02
1.77
Saint Lucia has embraced the public private GNI per capita, PPP (current international $) 5,560 7,480 10,280 11,370
partnership (PPP) model, recognizing the People
benefits private-sector participation provides, Income share held by lowest 20% .. .. .. ..
including innovation, operational efficiencies and Life expectancy at birth, total (years) 71 71 74 75
alleviating pressure on public finances. Cabinet Fertility rate, total (births per woman) 3.4 2.2 1.5 1.5
may by order published in the Gazette grant Adolescent fertility rate (births per 1,000 women ages 15-19) 105 65 58 53
47
special incentives in respect of those specially Contraceptive prevalence, any methods (% of women ages 15-49) 47 .. 100 56 .. ..
99
Births attended by skilled health staff (% of total)
qualified investments within this sector.
Mortality rate, under 5 (per 1,000 live births) 23 18 16 14
Opportunities for investments in Hard Prevalence of underweight, weight for age (% of children under 5) 82 .. 88 .. 2.8 99 ..
95
Immunization, measles (% of children ages 12-23 months)
Infrastructure include: Primary completion rate, total (% of relevant age group) 124 105 108 ..
• Airports School enrollment, primary (% gross) 141.6 103.5 100.3 ..
• Seaports School enrollment, secondary (% gross) 49 74 95 85
• Bridges School enrollment, primary and secondary (gross), gender parity index (GPI) 1 .. 1 .. 1 .. .. ..
Prevalence of HIV, total (% of population ages 15-49)
• Roads Environment
• Highways Forest area (sq. km) (thousands) 0.2 0.2 0.2 0.2
Terrestrial and marine protected areas (% of total territorial area) 0.6 0.6 .. 0.7
Opportunities for investments in Soft Annual freshwater withdrawals, total (% of internal resources) .. .. 14.3 14.3
Infrastructure include: Improved water source (% of population with access) 93 94 96 96
• Health care facilities Improved sanitation facilities (% of population with access) 78 83 89 91
2.6
• Research institutions/facilities Urban population growth (annual %) 405 0.4 .. -3.1 0.7 ..
765
Energy use (kg of oil equivalent per capita)
• Reputable offshore universities CO2 emissions (metric tons per capita) 1.17 2.10 2.34 2.31
• Voice and call centre operations Electric power consumption (kWh per capita) .. .. .. ..
Economy
• Business process outsourcing (BPO) GDP (current US$) (billions) 0.48 0.78 1.24 1.38
• Knowledge process outsourcing (KPO) GDP growth (annual %) 7.8 -0.2 -1.7 0.7
operations Inflation, GDP deflator (annual %) 8.1 1.3 7.0 -4.3
• Technology and hospitality training Agriculture, value added (% of GDP) 12 6 3 3
institutions Industry, value added (% of GDP) 15 17 16 14
• Alternative energy production Services, etc., value added (% of GDP) 73 77 81 83
Exports of goods and services (% of GDP)
60
48
49
48
Imports of goods and services (% of GDP) 69 57 63 53
CITIZENSHIP BY INVESTMENT Gross capital formation (% of GDP) 20 27 28 21
PROGRAMME Revenue, excluding grants (% of GDP) .. 22.9 23.1 24.1
The Citizenship by Investment Programme was Net lending (+) / net borrowing (-) (% of GDP) .. -1.1 -0.6 -3.0
States and markets
established in January 2016 as a framework Time required to start a business (days) .. .. 14 11
under which Saint Lucian citizenship can be Domestic credit provided by financial sector (% of GDP) 48.2 70.6 112.2 96.6
obtained following a quantum of investment in Tax revenue (% of GDP) .. 20.3 21.7 22.9
one of four programs: Military expenditure (% of GDP) .. .. .. ..
• Saint Lucia National Economic Fund Mobile cellular subscriptions (per 100 people) 0.0 1.6 111.7 94.8
Individuals using the Internet (% of population) 0.0 5.1 43.3 46.7
• Real Estate Projects High-technology exports (% of manufactured exports) 1 6 17 5
• Enterprise Projects Overall level of statistical capacity (scale 0-100) .. .. 60 64
Global links
• Government Bonds Merchandise trade (% of GDP) 82 51 71 52
Net barter terms of trade index (2000 = 100) .. 100 103 123
Citizenship by Investment Unit External debt stocks, total (DOD, current US$) (millions) 79 222 580 529
5th Floor, Francis Compton Building Total debt service (% of exports of goods, services and primary income) 2.2 7.9 7.4 10.6
Waterfront, Castries Net migration (thousands) -5 0 0 ..
29
Saint Lucia, LC04 301 Personal remittances, received (current US$) (millions) 16 24 121 30
Foreign direct investment, net inflows (BoP, current US$) (millions)
54
95
45
Tel: (758) 458-6050 Net official development assistance received (current US$) (millions) 12.3 11.1 41.2 13.2
Figures in italics refer to periods other than those specified. Source: World Development Indicators database.
JTZ Publishing B-91