
Page 133 - Caribbean-Central America Profile 2018
P. 133
ST VINCENT & THE GRENADINES
CARIBBEAN-CENTRAL AMERICA PROFILE 2018
Country Profile TOURISM
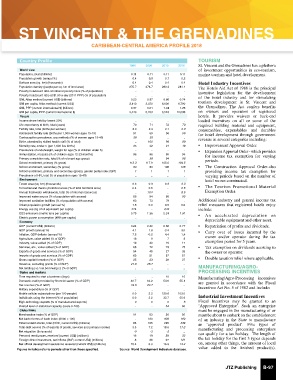
1990 2000 2010 2016 St. Vincent and the Grenadines has a plethora
World view of investment opportunities in eco-tourism,
Population, total (millions) 0.11 0.11 0.11 0.11 marine tourism and hotel development.
Population growth (annual %) 0.4 0.0 0.1 0.2
Surface area (sq. km) (thousands) 0.4 0.4 0.4 0.4 Hotel Industry Incentives
Population density (people per sq. km of land area) 275.7 276.7 280.3 281.1 The Hotels Aid Act of 1988 is the principal
Poverty headcount ratio at national poverty lines (% of population) .. .. .. .. incentive legislation for the development
Poverty headcount ratio at $1.90 a day (2011 PPP) (% of population) .. .. .. .. of the hotel industry and for stimulating
GNI, Atlas method (current US$) (billions) 0.23 0.37 0.66 0.74 tourism development in St. Vincent and
GNI per capita, Atlas method (current US$) 2,110 3,470 6,030 6,790
GNI, PPP (current international $) (billions) 0.37 0.61 1.04 1.26 the Grenadines. The Act confers benefits
GNI per capita, PPP (current international $) 3,440 5,700 9,540 11,530 on owners and operators of registered
People hotels. It provides waivers or back-end
loaded incentives on all or some of the
Income share held by lowest 20% .. .. .. ..
Life expectancy at birth, total (years) 70 71 72 73 required building material and equipment,
Fertility rate, total (births per woman) 3.0 2.4 2.1 2.0 consumables, expendables and durables
Adolescent fertility rate (births per 1,000 women ages 15-19) 91 69 56 50 for hotel development through government
Contraceptive prevalence, any methods (% of women ages 15-49) 58 58 .. .. revenue in several categories including:
Births attended by skilled health staff (% of total) .. 100 98 99
Mortality rate, under-5 (per 1,000 live births) 25 22 21 18 • Improvement Approval Order.
Prevalence of underweight, weight for age (% of children under 5) .. .. .. .. • Expansion Approval Order - which provides
Immunization, measles (% of children ages 12-23 months) 96 96 99 99 for income tax exemption for varying
Primary completion rate, total (% of relevant age group) .. 93 94 98 periods.
School enrollment, primary (% gross) 113.3 117.9 105.0 104.5
School enrollment, secondary (% gross) 60 83 108 106 • The Construction Approval Order-also
School enrollment, primary and secondary (gross), gender parity index (GPI) 1 1 1 1 providing income tax exemption for
Prevalence of HIV, total (% of population ages 15-49) .. .. .. .. varying periods based on the number of
Environment hotel rooms constructed.
Forest area (sq. km) (thousands) 0.3 0.3 0.3 0.3 • The Tourism Promotional Material
Terrestrial and marine protected areas (% of total territorial area) 0.4 0.5 .. 0.5
Annual freshwater withdrawals, total (% of internal resources) .. 10.0 .. 8.5 Exemption Order.
Improved water source (% of population with access) 88 94 95 95
Improved sanitation facilities (% of population with access) 63 73 76 .. Additional industry and general income tax
relief measures that registered hotels enjoy
Urban population growth (annual %) 1.8 0.8 0.8 0.9
Energy use (kg of oil equivalent per capita) 274 .. 642 .. include:
CO2 emissions (metric tons per capita) 0.75 1.36 2.01 1.91 • An accelerated depreciation on
Electric power consumption (kWh per capita) .. .. .. .. depreciable equipment and other asset.
Economy
• Repatriation of profits and dividends.
GDP (current US$) (billions) 0.24 0.40 0.68 0.77
GDP growth (annual %) 4.1 1.6 -3.4 3.0 • Carry over of losses incurred by the
Inflation, GDP deflator (annual %) 7.5 -0.2 4.4 1.4 owner and/or operator during the tax
Agriculture, value added (% of GDP) 16 9 7 8 exemption period for 5 years.
Industry, value added (% of GDP) 19 20 19 17
• Tax exemption on dividends accruing to
Services, etc., value added (% of GDP) 65 72 73 75
Exports of goods and services (% of GDP) 54 45 27 26 the owner or operator.
Imports of goods and services (% of GDP) 63 51 57 51 • Double taxation relief where applicable.
Gross capital formation (% of GDP) 25 23 29 27
Revenue, excluding grants (% of GDP) 21.8 25.7 .. ..
Net lending (+) / net borrowing (-) (% of GDP) .. .. .. .. MANUFACTURING/AGRO-
States and markets PROCESSING INCENTIVES
Time required to start a business (days) .. .. 10 10 Manufacturing/Agro-Processing incentives
Domestic credit provided by financial sector (% of GDP) 40.7 64.2 54.9 55.1 are granted in accordance with the Fiscal
Tax revenue (% of GDP) 19.0 20.7 .. .. Incentives Act No. 5 of 1982 and include:
Military expenditure (% of GDP) .. .. .. ..
Mobile cellular subscriptions (per 100 people) 0.0 2.2 120.6 103.0
Individuals using the Internet (% of population) 0.0 3.2 33.7 55.6 Industrial Investment Incentives
High-technology exports (% of manufactured exports) 0 0 0 8 Fiscal Incentives may be granted to an
Overall level of statistical capacity (scale 0-100) .. .. 54 60 ‘Approved Enterprise’. Such an enterprise
Global links must be engaged in the manufacturing of or
Merchandise trade (% of GDP) 91 53 56 50 must be about to embark on the establishment
Net barter terms of trade index (2000 = 100) .. 100 108 100 of an industry in the State to manufacture
an ‘approved product’. Five types of
External debt stocks, total (DOD, current US$) (millions) 63 195 295 339
Total debt service (% of exports of goods, services and primary income) 3.3 7.2 18.6 17.2 manufacturing and processing enterprises
Net migration (thousands) -9 -5 -5 .. can qualify for a tax holiday. The length of
Personal remittances, received (current US$) (millions) 16 19 29 32 the tax holiday for the first 3 types depends
Foreign direct investment, net inflows (BoP, current US$) (millions) 8 38 97 121
Net official development assistance received (current US$) (millions) 15.4 6.3 16.9 13.2 on, among other things, the amount of local
value added to the finished product(s).
Figures in italics refer to periods other than those specified. Source: World Development Indicators database.
JTZ Publishing B-97