
Page 94 - Caribbean-Central America Profile 2018
P. 94
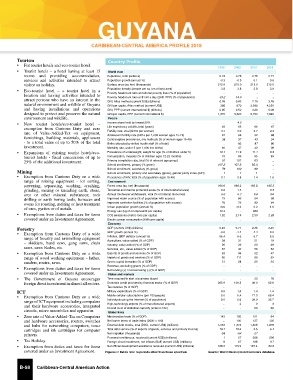
GUYANA


                                       CARIBBEAN-CENTRAL AMERICA PROFILE 2018


        Tourism                               Country Profile
        •  For tourist hotels and eco-tourist hotel.
                                                                                            1990   2000   2010   2016
        •  Tourist hotels – a hotel having at least 15   World view
           rooms and  providing  accommodation,   Population, total (millions)               0.74   0.75  0.75   0.77
           services  and activities  intended  to attract   Population growth (annual %)     -0.3   -0.3   0.1    0.6
           visitor on holiday.                Surface area (sq. km) (thousands)             215.0  215.0  215.0  215.0
        •  Eco-tourist  hotel  – a  tourist  hotel  in  a   Population density (people per sq. km of land area)  3.8  3.8  3.8  3.9
           location  and having activities  intended to   Poverty headcount ratio at national poverty lines (% of population)  ..  ..  ..  ..
           attract persons who have an interest in the   Poverty headcount ratio at $1.90 a day (2011 PPP) (% of population)  33.2  14.0  2.19 ..  3.28 ..
                                                                                             0.28
                                                                                                    0.65
                                              GNI, Atlas method (current US$) (billions)
           natural environment and wildlife of Guyana   GNI per capita, Atlas method (current US$)  380  870  2,930  4,250
           and having installations  and operations   GNI, PPP (current international $) (billions)  0.95  2.50  4.29  6.08
           designed to protect and preserve the natural   GNI per capita, PPP (current international $)  1,270  3,320  5,750  7,860
           environment and wildlife.          People
        •  New tourist  hotels/eco-tourist  hotel  –   Income share held by lowest 20%        ..    4.5     ..     ..
           exemption  from Customs Duty and zero   Life expectancy at birth, total (years)    63     65    66     67
           rate of  Value-Added-Tax on equipment,   Fertility rate, total (births per woman)  3.1   3.0    2.7    2.5
           furnishings,  building  materials,  appliances   Adolescent fertility rate (births per 1,000 women ages 15-19)  97  98  92  88
                                                                                              38
                                                                                                           43
                                                                                                     37
                                              Contraceptive prevalence, any methods (% of women ages 15-49)
                                                                                                                  34
           - to a total value of up to 50% of the total   Births attended by skilled health staff (% of total)  ..  83  87  86
           investment.                        Mortality rate, under 5 (per 1,000 live births)  60    47    42     39
        •  Expansions of existing  tourist  hotels/eco-  Prevalence of underweight, weight for age (% of children under 5)  16.1  11.9  11.1  8.5
           tourist  hotels  - fiscal  concessions  of up  to   Immunization, measles (% of children ages 12-23 months)  73  86  95  99
           25% of the additional investment.  Primary completion rate, total (% of relevant age group)  97  107  83  ..
                                              School enrollment, primary (% gross)          107.2  107.2  85.4     ..
        Mining                                School enrollment, secondary (% gross)          79 1  102 1  89 1    .. ..
                                              School enrollment, primary and secondary (gross), gender parity index (GPI)
        •  Exemption  from  Customs Duty on a  wide   Prevalence of HIV, total (% of population ages 15-49)  0.1  0.8  1.4  1.6
           range of mining equipment  - for sorting,   Environment
           screening,  separating,  washing,  crushing,   Forest area (sq. km) (thousands)  166.6  166.2  165.8  165.3
           grinding, mixing or kneading earth, stone,   Terrestrial and marine protected areas (% of total territorial area)  0.2  1.3  ..  5.3
           ores or other  mineral  substances;  rock   Annual freshwater withdrawals, total (% of internal resources)  0.6  0.7  0.6  0.6
           drilling or earth boring tools; furnaces and   Improved water source (% of population with access)  79  86  94  98
           ovens for roasting, melting or heat treatment   Improved sanitation facilities (% of population with access)  76  79  83  84
           of ores, pyrites or of metals.     Urban population growth (annual %)             -0.6   -0.6   0.2    1.0
                                                                                             514
                                                                                                           669
        •  Exemptions from duties and taxes for items   Energy use (kg of oil equivalent per capita)  1.52  2.14 ..  2.30  2.63 ..
                                              CO2 emissions (metric tons per capita)
           covered under an Investment Agreement.  Electric power consumption (kWh per capita)  ..   ..     ..     ..
                                              Economy
        Forestry                              GDP (current US$) (billions)                   0.40   0.71  2.26   3.45
        •  Exemption from Customs Duty of a wide   GDP growth (annual %)                     -3.0   -1.4   4.4    3.3
           range of forestry and sawmilling equipment   Inflation, GDP deflator (annual %)   56.4   6.6    6.7    5.0
           – skidders, band  saws, gang  saws, chain   Agriculture, value added (% of GDP)    38     31    21     19
           saws, saws blades, etc.            Industry, value added (% of GDP)                25     29    23     29
                                                                                              37
                                                                                                     40
                                              Services, etc., value added (% of GDP)
                                                                                                                  52
                                                                                                           56
        •  Exemption  from  Customs Duty on a  wide   Exports of goods and services (% of GDP)  63   96    52     47
           range of wood working equipment – lathes,   Imports of goods and services (% of GDP)  80  111   80     59
           sanders, routes, saws.             Gross capital formation (% of GDP)              31     24    25     30
        •  Exemptions from duties and taxes for items   Revenue, excluding grants (% of GDP)  ..     ..     ..     ..
           covered under an Investment Agreement.  Net lending (+) / net borrowing (-) (% of GDP)  ..  ..   ..     ..
                                              States and markets
        •  The Government of Guyana encourages   Time required to start a business (days)     ..     ..    23     18
           foreign direct investment in almost all sectors.  Domestic credit provided by financial sector (% of GDP)  265.9  100.5  49.0  62.6
                                              Tax revenue (% of GDP)                          ..     ..     ..     ..
        ICT                                   Military expenditure (% of GDP)                0.9    1.8    1.4    1.4
        •  Exemption  from  Customs Duty on a  wide   Mobile cellular subscriptions (per 100 people)  0.0  5.4  71.3  66.4
           range of ICT equipment including computers   Individuals using the Internet (% of population)  0.0  6.6  29.9  35.7
           and  their hardware  accessories,  integrated   High-technology exports (% of manufactured exports)  ..  2  0  0
           circuits, micro assemblies and apparatus  Overall level of statistical capacity (scale 0-100)  ..  ..  53  58
                                              Global links
        •  Zero rate of Value-Added-Tax on Computers   Merchandise trade (% of GDP)          143    150    101    84
           and hardware accessories, routers, switches   Net barter terms of trade index (2000 = 100)  ..  100  127  120
           and  hubs for networking  computers,  toner   External debt stocks, total (DOD, current US$) (millions)  1,963  1,374  1,408  1,639
           cartridges  and  ink cartridges  for computer   Total debt service (% of exports of goods, services and primary income)  18.7  10.2  2.6  6.4
           printers.                          Net migration (thousands)                      -58    -64    -27     ..
        •  Tax Holiday.                       Personal remittances, received (current US$) (millions)  1 8  27  368  296
                                                                                                                  117
                                                                                                           198
                                              Foreign direct investment, net inflows (BoP, current US$) (millions)
                                                                                                    67
        •  Exemption from duties and taxes for items   Net official development assistance received (current US$) (millions)  168.3  115.9  167.4  30.9
           covered under an Investment Agreement.  Figures in italics refer to periods other than those specified.                        Source: World Development Indicators database.
         B-58   Caribbean-Central American Action