
Page 16 - HW September 2020
P. 16
stats watch
Core Retailing – Jun-Aug 2020 –
% Likelihood of failure in the next 18 months
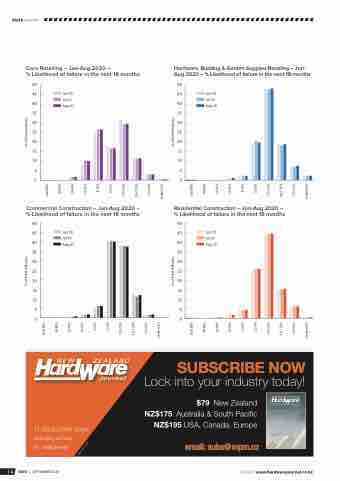
Hardware, Building & Garden Supplies Retailing – Jun- Aug 2020 – % Likelihood of failure in the next 18 months
50 50
50 5 50
50
50 5
45 Jun 20 45
Jul 20 Aug 20
45 Jun 20 4 45
45
45 Jul 20 4
40 40
40 4 40
40
40 Aug 20 4
35 35
35 3 35
35
35 3
30 30
30 3 30
30
30 3
25 25
25 2 25
25
25 2
20 20
20 2 20
20
20 2
15 15
15 1 15
15
15 1
10 10
10 1 10
10 10 1 55
55 55
00 00
00
Commercial Construction – Jun-Aug 2020 – Residential Construction – Jun-Aug 2020 –
% Likelihood of failure in the next 18 months % Likelihood of failure in the next 18 months
50 50 5 50 50 5
50 50
45 45 4
45 Jun 20 45 Jun 20 4 45 45
40 Jul 20 40 Jul 20 4 40 40 4
40 Aug 20 40
35 35 3
35 35 3 35 35
30 30 3 30 30 3
30 30
25 25 2
25 25 2 25 25
20 20 2 20 20 2
20 20
15 15 1
15 15 1 15 15
10 10 1 10 10 1
Aug 20
10 10 55
55 55 00
00 00
11 ISSUES PER YEAR: including annual
A1 wallplanner
SUBSCRIBE NOW
Lock into your industry today!
$79 New Zealand NZ$175 Australia & South Pacific NZ$195 USA, Canada, Europe
email: subs@mpm.nz
+
Firth designer bricks – a sharp look
14 NZHJ | SEPTEMBER 2020
MORE AT www.hardwarejournal.co.nz
0
0
5
5
0
0
5
5
0
0
5
5
0
0
5
5
0
0
5
5
0
0
Over 80% 40-80% 20-40% 10-20% 5-10% 2.5-5% 1.25-2.5% 0.6-1.25% 0.3-0.6% Under 0.3%
Over 80% 40-80% 20-40% 10-20% 5-10% 2.5-5% 1.25-2.5% 0.6-1.25% 0.3-0.6% Under 0.3%
Over 80% 40-80% 20-40% 10-20% 5-10% 2.5-5% 1.25-2.5% 0.6-1.25% 0.3-0.6% Under 0.3%
Over 80% 40-80% 20-40% 10-20% 5-10% 2.5-5% 1.25-2.5% 0.6-1.25% 0.3-0.6% Under 0.3%
% of total industry
% of total industry
% of total industry
% of total industry
MPM 8447 0816
