
Page 17 - @Annual Report_PLN Batam__2019_Lowress_Neat
P. 17
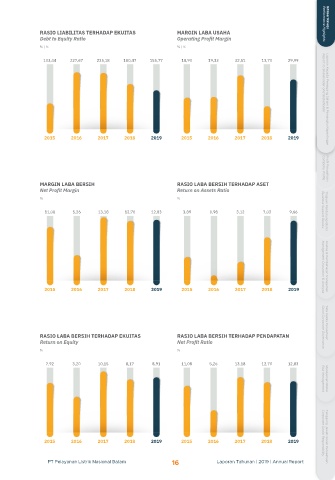
ARUS KAS DIGUNAKAN UNTUK AKTIVITAS INVESTASI  ARUS KAS DARI AKTIVITAS PENDANAAN  RASIO LIABILITAS TERHADAP EKUITAS  MARGIN LABA USAHA  Performance Highlights  Ikhtisar Kinerja
 Cash Flows Used for Investing Activities  Cash Flows from Financing Activities  Debt to Equity Ratio  Operating Profit Margin
 Rp (Juta) | Rp (Million)  Rp (Juta) | Rp (Million)  % | %      % | %

 420.454  6.788.781  775.624  1.116.681  857.399  103,44  227,67  225,18  180,47  155,77  18,90  19,33  32,51  13,70  29,99

 2015  2016  2017  2018  2019                                                                                       Report to Shareholder and Stakeholder  Laporan Kepada Pemegang Saham & Pemangku Kepentingan


 2015  2016  2017  2018  2019  2015  2016  2017  2018  2019      2015      2016     2017      2018     2019
  (499.817)  (7.754.098)  (1.601.162)  (260.763)  (215,864)


 RASIO KAS  RASIO UJI CAIR  MARGIN LABA BERSIH                  RASIO LABA BERSIH TERHADAP ASET                     Company Profile  Profil Perusahaan
 Cash Ratio  Quick Ratio  Net Profit Margin                      Return on Assets Ratio
 %  %          %                                                %

 82,09  9,52  44,08  25,16  26,86  114,34  35,09  111,64  96,54  87,64  11,08  5,26  13,18  12,70  12,83  3,89  0,98  3,12  7,03  9,66  Business Support Review  Tinjauan Pendukung Bisnis


 2015  2016  2017  2018  2019  2015  2016  2017  2018  2019  2015  2016  2017  2018  2019  2015  2016  2017  2018  2019  Management Discussion & Analysis  Analisa & Pembahasan Manajemen


 RASIO LANCAR  RASIO LIABILITAS TERHADAP ASET  RASIO LABA BERSIH TERHADAP EKUITAS  RASIO LABA BERSIH TERHADAP PENDAPATAN  Good Corporate Governance  Tata Kelola Perusahaan
 Current Ratio  Debt to Assets Ratio  Return on Equity          Net Profit Ratio
 %  %          %                                                %

 119,45  36,65  115,19  99,11  91,66  50,84  69,48  69,25  64,35  60,90  7,92  3,20  10,15  8,17  8,91  11,08  5,26  13,18  12,70  12,83  Risk Management  Manajemen Risiko


 2015  2016  2017  2018  2019  2015  2016  2017  2018  2019  2015  2016  2017  2018  2019  2015  2016  2017  2018  2019  Corporate Social Responsibility  Tanggung Jawab Sosial Perusahaan


                  PT Pelayanan Listrik Nasional Batam         16              Laporan Tahunan | 2019 | Annual Report