
Page 108 - Zero Net Energy Case Study Buildings-Volume 1
P. 108
CASE STUDY NO. 5
SCIENCE & ENGINEERING BUILDING I
Electrical Plug Loads
Management of plug loads is a concern in all low-energy buildings and circuit metering is reveal- ing the large impact of these user-controlled electrical loads. In laboratory buildings, plug loads make up a large percentage of the total energy demand due to high wattage equipment such as cryogenic freezers and high energy lasers. UC Merced staff are working with lab users to deter- mine if these loads can be reduced or managed to minimize energy use. Some of this equipment is installed without meters, which introduces an locally unmetered electric energy load. This is referred to as “unrecorded plug load” in the measurement summary charts.
Energy Design Analysis and Energy Performance
Modeling versus Initial Post-Occupancy Measurements
Energy Use - Modeling
As noted in the introduction to this publication, computer-based modeling of the energy perfor- mance of buildings continues to be a developing area of technology. Assumptions in the model- ing analysis about patterns of use and hourly variations in site weather conditions strongly affect the resulting performance outputs. Therefore, the ability to show during the design phase that the building will meet targeted energy budgets is limited and cannot be predictive. In some ways, the design modeling is an ideal of a well-operated building with energy-conscious users. As has been discovered with the close measurement of new low-energy buildings, the ideal is usually not real and actual performance falls short of the design model results. It is through diligent cor- rection and adjustment of the building systems and the attentive work with the building users that the ideal can be achieved.
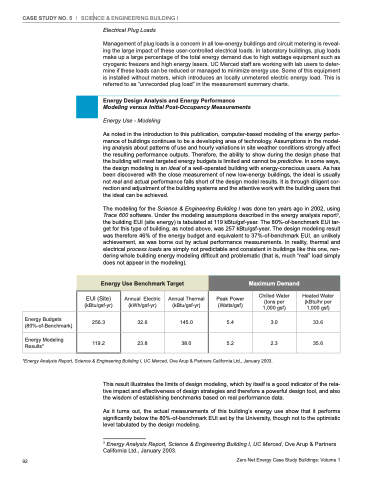
The modeling for the Science & Engineering Building I was done ten years ago in 2002, using Trace 600 software. Under the modeling assumptions described in the energy analysis report3, the building EUI (site energy) is tabulated at 119 kBtu/gsf-year. The 80%-of-benchmark EUI tar- get for this type of building, as noted above, was 257 kBtu/gsf-year. The design modeling result was therefore 46% of the energy budget and equivalent to 37%-of-benchmark EUI, an unlikely achievement, as was borne out by actual performance measurements. In reality, thermal and electrical process loads are simply not predictable and consistent in buildings like this one, ren- dering whole building energy modeling difficult and problematic (that is, much “real” load simply does not appear in the modeling).
Energy Use Benchmark Target
Maximum Demand
Energy Budgets (80%-of-Benchmark)
Energy Modeling Results*
EUI (Site) (kBtu/gsf-yr)
256.3
119.2
Annual Electric (kWh/gsf-yr)
32.6
23.8
Annual Thermal (kBtu/gsf-yr)
145.0 38.0
Peak Power (Watts/gsf)
5.4
5.2
Chilled Water (tons per 1,000 gsf)
3.0
2.3
Heated Water (kBtu/hr per 1,000 gsf)
33.6
35.6
*Energy Analysis Report, Science & Engineering Building I, UC Merced, Ove Arup & Partners California Ltd., January 2003.
92
Zero Net Energy Case Study Buildings: Volume 1
This result illustrates the limits of design modeling, which by itself is a good indicator of the rela- tive impact and effectiveness of design strategies and therefore a powerful design tool, and also the wisdom of establishing benchmarks based on real performance data.
As it turns out, the actual measurements of this building’s energy use show that it performs significantly below the 80%-of-benchmark EUI set by the University, though not to the optimistic level tabulated by the design modeling.
3 Energy Analysis Report, Science & Engineering Building I, UC Merced, Ove Arup & Partners California Ltd., January 2003.
