
Page 124 - Zero Net Energy Case Study Buildings-Volume 1
P. 124
CASE STUDY NO. 6
CLASSROOM & OFFICE BUILDING
Energy Design Analysis and Energy Performance
Modeling versus Initial Post-Occupancy Measurements
Energy Use - Modeling
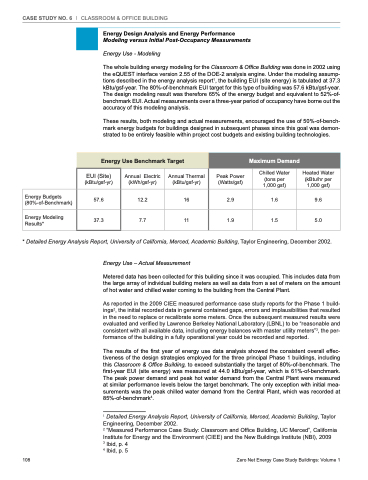
The whole building energy modeling for the Classroom & Office Building was done in 2002 using the eQUEST interface version 2.55 of the DOE-2 analysis engine. Under the modeling assump- tions described in the energy analysis report1, the building EUI (site energy) is tabulated at 37.3 kBtu/gsf-year. The 80%-of-benchmark EUI target for this type of building was 57.6 kBtu/gsf-year. The design modeling result was therefore 65% of the energy budget and equivalent to 52%-of- benchmark EUI. Actual measurements over a three-year period of occupancy have borne out the accuracy of this modeling analysis.
These results, both modeling and actual measurements, encouraged the use of 50%-of-bench- mark energy budgets for buildings designed in subsequent phases since this goal was demon- strated to be entirely feasible within project cost budgets and existing building technologies.
Energy Use Benchmark Target
Maximum Demand
Energy Budgets (80%-of-Benchmark)
Energy Modeling Results*
EUI (Site) (kBtu/gsf-yr)
57.6 37.3
Annual Electric (kWh/gsf-yr)
12.2 7.7
Annual Thermal (kBtu/gsf-yr)
16 11
Peak Power (Watts/gsf)
2.9
1.9
Chilled Water (tons per 1,000 gsf)
1.6
1.5
Heated Water (kBtu/hr per 1,000 gsf)
9.6
5.0
* Detailed Energy Analysis Report, University of California, Merced, Academic Building, Taylor Engineering, December 2002. Energy Use – Actual Measurement
Metered data has been collected for this building since it was occupied. This includes data from the large array of individual building meters as well as data from a set of meters on the amount of hot water and chilled water coming to the building from the Central Plant.
As reported in the 2009 CIEE measured performance case study reports for the Phase 1 build- ings2, the initial recorded data in general contained gaps, errors and implausibilities that resulted in the need to replace or recalibrate some meters. Once the subsequent measured results were evaluated and verified by Lawrence Berkeley National Laboratory (LBNL) to be “reasonable and consistent with all available data, including energy balances with master utility meters”3, the per- formance of the building in a fully operational year could be recorded and reported.
The results of the first year of energy use data analysis showed the consistent overall effec- tiveness of the design strategies employed for the three principal Phase 1 buildings, including this Classroom & Office Building, to exceed substantially the target of 80%-of-benchmark. The first-year EUI (site energy) was measured at 44.0 kBtu/gsf-year, which is 61%-of-benchmark. The peak power demand and peak hot water demand from the Central Plant were measured at similar performance levels below the target benchmark. The only exception with initial mea- surements was the peak chilled water demand from the Central Plant, which was recorded at 85%-of-benchmark4.
1 Detailed Energy Analysis Report, University of California, Merced, Academic Building, Taylor Engineering, December 2002.
2 “Measured Performance Case Study: Classroom and Office Building, UC Merced”, California Institute for Energy and the Environment (CIEE) and the New Buildings Institute (NBI), 2009
3 Ibid, p. 4 4 Ibid, p. 5
108
Zero Net Energy Case Study Buildings: Volume 1
