
Page 97 - Zero Net Energy Case Study Buildings-Volume 1
P. 97
UNIVERSITY OF CALIFORNIA, MERCED
CASE STUDIES NO. 5 AND 6
possibly be achieved on a trajectory toward 2020, ensuring that the campus as a whole would reach ZNE by that year.
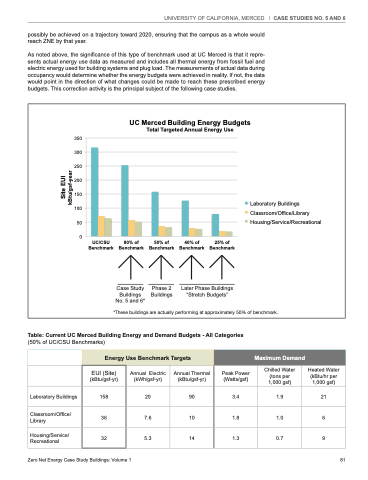
As noted above, the significance of this type of benchmark used at UC Merced is that it repre- sents actual energy use data as measured and includes all thermal energy from fossil fuel and electric energy used for building systems and plug load. The measurements of actual data during occupancy would determine whether the energy budgets were achieved in reality. If not, the data would point in the direction of what changes could be made to reach these prescribed energy budgets. This correction activity is the principal subject of the following case studies.
350
300
250
200
150
100
50 0
Laboratory Buildings Classroom/Office/Library Housing/Service/Recreational
UC Merced Building Energy Budgets Total Targeted Annual Energy Use
UC/CSU
Benchmark Benchmark Benchmark Benchmark Benchmark
80% of
50% of
40% of
25% of
Axis Title
No. 5 and 6*
*These buildings are actually performing at approximately 50% of benchmark.
Case Study Phase 2 Later Phase Buildings Buildings Buildings “Stretch Budgets”
Table: Current UC Merced Building Energy and Demand Budgets - All Categories
(50% of UC/CSU Benchmarks)
Energy Use Benchmark Targets
Maximum Demand
Laboratory Buildings
Classroom/Office/ Library
Housing/Service/ Recreational
EUI (Site) (kBtu/gsf-yr)
158
Annual Electric (kWh/gsf-yr)
20
Annual Thermal (kBtu/gsf-yr)
90
Peak Power (Watts/gsf)
3.4
Chilled Water (tons per 1,000 gsf)
1.9
Heated Water (kBtu/hr per 1,000 gsf)
21
36 7.6 10 1.8 1.0 6
32 5.3 14 1.3 0.7 9
Zero Net Energy Case Study Buildings: Volume 1 81
Site EUI kBtu/gsf-year
