
Page 34 - CITN 2017 Journal
P. 34
up the rural areas through the provision of good roads, on the average, which facilitated the
rural transformation in the state to fair extent.
In addition, Oseni (2013) claims that IGRs were fully maximised before the 1976 LG
reforms and that LG's functions were duly discharged with little or no assistance from the
Federal Government. However with the introduction of SAs, after the 1976 reform, the
internal generation as a major means of financing local government activities was
abandoned in preference to the revenue from the Federation Account.
On the areas of application of revenue of the LG, the completed capital projects in the LG
were grouped into three areas: Road, Electricity and Building. Table 5 shows the
percentage share of capital projects from the revenue of the LG. It could be seen from the
table that Road had highest percentage of the capital project of Osogbo LG. This is
followed by Electricity, while Building had the least. Projects on road comprises
construction of drainage, drainage box culverts, ring - culvert, block-wall lines, drainage,
retaining wall expansion of culvert, rehabilitation of roads, construction and repairs of line
drainage, rubble stones, retaining wall and literate filling. On the electricity, there is
extension of electricity and street lights, purchase and installation of transformers, sub-
station and commissioning of transformers. Projects in Building group are conversion of
existing or uncompleted classrooms blocks to offices of Osogbo LG area, complete re-
roofing of Town Planning building and filing of burglary proof. Capital projects are often
called infrastructures and it is a long term investment project requiring relatively large
amount of money to acquire, develop, improve and/or maintain.
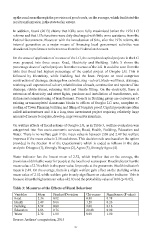
On welfare effects of fiscal actions of Osogbo LG, as in Table 3, welfare evaluation was
categorized into five socio-economic services; Road, Health, Building, Education and
Water. There is no welfare gain if the mean value is between 2.00 and 2.49 but welfare
improves if the mean value is 2.50 and above. This decision rule was based on the option
provided in the Section B of the Questionnaire which is coded as follows in the data
analysis: Disagree (1), Strongly Disagree (2), Agree (3), Strongly Agree (4).
Water indicator has the lowest mean of 2.32, which implies that on the average, the
provision of drinkable water for people at the local level seems poor. Road indicator has the
mean value of 2.36 which is also poor value for people at the grassroots. Health indicator's
mean is 2.49. On the average, there is a slight welfare gain effect on the Building with a
mean value of 2.52 while welfare gain is only significant on education indicator. This is
because it has the highest mean value of 2.83 and the probability value of 0.00 (p<0.05).
Table 3: Measures of the Effects of Fiscal Behaviour
Variables Mean Standard Deviation Chi-square Significance (P value)
Road 2.36 0.82 0.80 0.78
Health 2.49 0.66 1.28 0.26
Building 2.52 0.80 2.00 0.16
Education 2.83 0.76 20.48 0.00
Water 2.32 1.00 0.00 1.00
Source: Authors' computation, 2015
27