Page 28 - GM's Annual Inspection DEC - 2022
        P. 28
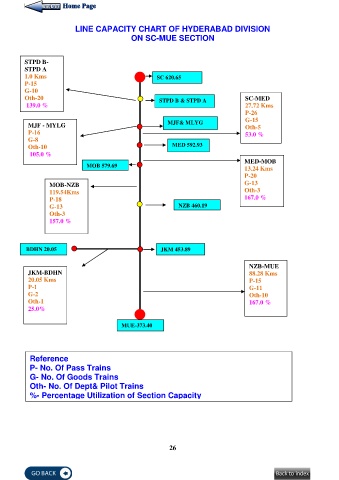
     LINE CAPACITY CHART OF HYDERABAD DIVISION
                                               ON SC-MUE SECTION
          STPD B-
          STPD A
          1.0 Kms                                       SC 620.65
          P-15
          G-10
          Oth-20                                         STPD B & STPD A               SC-MED
           139.0 %                                                                     27.72 Kms
                                                                                       P-26
                                                            MJF& MLYG                  G-15
           MJF - MYLG                                                                  Oth-5
           P-16                                                                        53.0 %
              G-8
           Oth-10                                            MED 592.93
            105.0 %
                                                                                       MED-MOB
                               MOB 579.69                                              13.24 Kms
                                                                                       P-20
                  MOB-NZB                                                              G-13
                  119.54Kms                                                            Oth-3
                                                                                       167.0 %
                  P-18                                          NZB 460.19
                  G-13
                  Oth-3
                  157.0 %
           BDHN 20.05                                    JKM 453.89
                                                                                         NZB-MUE
           JKM-BDHN                                                                      88.28 Kms
           20.05 Kms                                                                     P-15
              P-1                                                                        G-11
           G-2                                                                           Oth-10
           Oth-1                                                                         167.0 %
           25.0%
                                            MUE-373.40
              Reference
              P- No. Of Pass Trains
           G- No. Of Goods Trains
           Oth- No. Of Dept& Pilot Trains
              %- Percentage Utilization of Section Capacity
                                                            26
     	
