
Page 87 - Minerva Foods | Annual Report 2017
P. 87
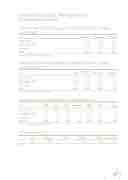
Human Resources Management/ Professional profile
Total number and percentage of employees by job category
and gender* 405-1
Area Total (No.)
Women (%)
Men (%)
60.65
70.58
80.43
69.47
  Administrative 1,667 39.35
Industrial/Operational 8,637 29.42
Commercial 470 19.57
Total 10,774 30.53
* Information only regarding operations in Brazil for 2017.
    Total number and percentage of employees by job category and age group* 405-1
 Area Total
Under 30 (%)
30 to 50 (%)
51.47
48.37
74.25
49.98
Black
63
455
19
5.00
Argentina
0.35
Over 50 (%)
5.70
7.38
5.33
7.02
Not stated
1
1
8
0.09
Total turnover
4.39
 Administrative 1,667 42.83
Industrial/Operational 8,637 44.25
Commercial 470 20.42
Total 10,774 43.00
* Information only regarding operations in Brazil for 2017.
    Total number of employees by minority groups* 405-1
 Area Grand total
Administrative 1,667
Industrial/Operational 8,637
Commercial 470
Total (%) 100
*Information only regarding operations in Brazil for 2017.
Asian
stated
226
31
2.83
White
1,074
3,193
354
42.89
Uruguay
0.53
Indigenous Mixed Race
1 480
9 4,753
0 58
0.09 49.10
Colombia
5.39
     Turnover rate (%)* 401-1
 Brazil Paraguay
3.93 11.77
  * Data for 2017.
 87
