
Page 42 - Minerva Foods Sustainability Report 2016
P. 42
Net revenue ended the year at R$9,648.7 mil- lion, 1.3% higher year-over-year. EBITDA totaled R$989 million and the EBITDA Margin was at 10.3%. e Company generated an operating cash ow of R$524.4 million.
2016 Sustainability Report
In relation to exports, Minerva Foods has kept a high market share in countries where it operates. In Brazil, these opera- tions reached a market share of 20%. While in Paraguay, the Company had a market share of 20%, in line with the gure reported in 2015. In Uruguay, market share was approxi- mately 15%.
Africa – Share in Africa fell by 3% year-over-year, account- ing for 14% of the Company's total exports. Cuts consumed in this region (especially front quarter cuts) were redistrib- uted to some Asian countries, especially China and Hong Kong, and to countries in the Middle East with the same consumer pro le.
Americas – As the biggest consumer in the region, Chile had revenue growth of 18%. is was followed by Brazil, which was supplied by exports from the Paraguay and Uruguay units. In total, the share in the Americas region saw growth of 3% compared to the previous year and accounted for 15% of total Company exports.
Asia – Accounting for 27% of total exports for the year, this region was up 3% compared to 2015. Performance is con- nected to consumption in important rising markets, as well as China: Vietnam, Malaysia, the Philippines, Taiwan and South Korea (currently supplied by Uruguay operations). Together, they had export revenue growth of over 50% for the period.
Eurasian Economic Union (EAEU) – e top destination in this region is Russia, which went from 10% of total Company exports in 2015 to 4% in 2016, as the result of depreciation of the Russian ruble in relation to the US dollar and a drop in the price of oil, which is Russia's main economic product. Minerva Foods redirected part of this region's volume to oth- er destinations, especially Asia and the Middle East.
Europe – As a consumer of prime cuts, this was the most pro table destination for exports. Volume ex- ported therefore accounted for 15% of total exports (12% in 2015).
NAFTA – e portion of exports going to the USA, Canada and Mexico remained at, accounting for 4% of all exports. e USA, which had previously been supplied solely by Uruguayan units, continued to be the top destination in this region. As of Octo- ber 2016, with the North American market opening up to fresh beef from Brazil, this market also began to be supplied by some national units.
Middle East – e region accounted for a share of 21% of total export revenue (in line with 2015), maintaining its place as the second ranked destina- tion for total exports, trailing only Asia. Countries with high revenue growth during the period were Israel, Lebanon and the United Arab Emirates.
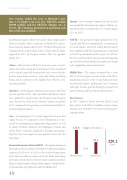
Investments
In 2016, Minerva Foods invested R$220.2 mil- lion; of this total, R$156.8 million went to main- taining assets and R$63.4 were put towards grow- ing operations.
156.8
Maintenance
Capex (R$ millions) 63.4
220.2
Total
40
2016
Expansion
