
Page 27 - Anuario Abrasca 19_20
P. 27
Retrospectiva Retrospective
OFERTA DE RECURSOS Offer of resources
Índices de Mercado Indexes – Exchange-traded funds market
2014
2015
2016
2017
2018
Índice de Governança (IGC) / Corporate Governance Index
7.969
7.015
9.042
11.747
13.124
Variação (%) / Variation (%)
2,32%
-11,97%
28,90%
29,92%
11,72%
Índice de Sustentabilidade (ISE) / Business Sustainability Index
2.432
2.118
2.410
2.830
3.109
Variação (%) / Variation (%)
-1,94%
-12,91%
13,79%
17,43%
9,86%
Índice Brasil 50 (IBrX-50) / Brazil-50 Index
8.466
7.358
10.066
12.765
14.620
Índice do Setor Industrial (INDX) / Industrial Sector Index
11.962
12.591
12.559
15.088
15.095
Índice Financeiro (IFNC) / Financial Index
4.939
4.325
6.367
8.021
10.127
Índice Small Cap (SMLL) / Small Cap Index
1.087
844
1.112
1.661
1.796
Índice Mid-Large Cap (MLCX) / Mid-Large Cap Index
951
840
1.153
1.445
1.683
Fonte: Bovespa
Source: São Paulo Stock Exchange (Bovespa)
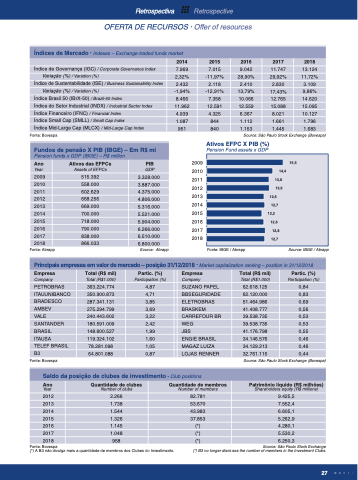
Ativos EFPC X PIB (%)
Pension Fund assets x GDP
Fundos de pensão X PIB (IBGE) – Em R$ mi
Pension funds x GDP (IBGE) – R$ million
Ano
Year
Ativos das EFPCs
Assets of EFPCs
PIB
GDP
2009
515.392
3.328.000
2010
558.000
3.887.000
2011
602.629
4.375.000
2012
668.256
4.806.000
2013
669.000
5.316.000
2014
700.000
5.521.000
2015
718.000
5.904.000
2016
790.000
6.266.000
2017
838.000
6.510.000
2018
866.033
6.800.000
2009
2010
2011
2012
2013
2014
2015
2016
2017
2018
15,5 14,4
13,8
13,9 12,6
12,7 12,2
12,6 12,8
12,7
Fonte: Abrapp
Source: Abrapp
Fonte: IBGE / Abrapp
Source: IBGE / Abrapp
Principais empresas em valor de mercado – posição 31/12/2018 Market capitalization ranking – position in 31/12/2018
Empresa
Company
Total (R$ mil)
Total (R$1.000)
Partic. (%)
Participation (%)
Empresa
Company
Total (R$ mil)
Total (R$1.000)
Partic. (%)
Participation (%)
PETROBRAS
363.224.774
4,87
SUZANO PAPEL
62.618.125
0,84
ITAUUNIBANCO
350.900.873
4,71
BBSEGURIDADE
62.120.000
0,83
BRADESCO
287.341.131
3,85
ELETROBRAS
51.464.986
0,69
AMBEV
275.294.799
3,69
BRASKEM
41.408.777
0,56
VALE
240.443.602
3,22
CARREFOUR BR
39.538.735
0,53
SANTANDER
180.591.009
2,42
WEG
39.538.735
0,53
BRASIL
148.600.527
1,99
JBS
41.176.798
0,55
ITAUSA
119.324.102
1,60
ENGIE BRASIL
34.146.576
0,46
TELEF BRASIL
78.281.098
1,05
MAGAZ LUIZA
34.129.213
0,46
B3
64.801.088
0,87
LOJAS RENNER
32.761.115
0,44
Fonte: Bovespa
Source: São Paulo Stock Exchange (Bovespa)
Saldo da posição de clubes de investimento Club positions
Ano
Year
Quantidade de clubes
Number of clubs
Quantidade de membros
Number of members
Patrimônio líquido (R$ milhões)
Shareholders equity (R$ millions)
2012
2.266
82.781
9.425,5
2013
1.738
53.670
7.552,4
2014
1.544
43.983
6.605,1
2015
1.326
37.853
5.262,9
2016
1.145
(*)
4.280,1
2017
1.048
(*)
5.530,2
2018
958
(*)
6.250,3
Fonte: Bovespa
(*) A B3 não divulga mais a quantidade de membros dos Clubes de Investimento.
Source: São Paulo Stock Exchange (*) B3 no longer discloses the number of members in the Investment Clubs.
27
