
Page 28 - Anuario Abrasca 19_20
P. 28
Retrospectiva Retrospective
MERCADODEDÍVIDA Debtmarket
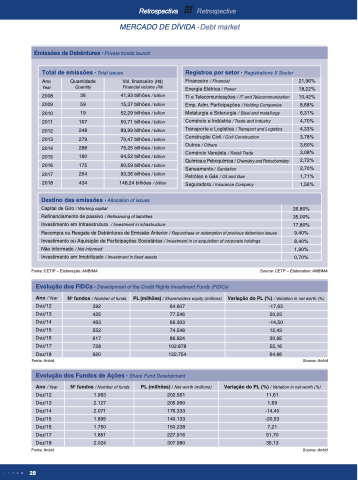
Emissões de Debêntures Private bonds launch
Total de emissões Total issues
Ano
Year
Quantidade
Quantity
Vol. financeiro (R$)
Financial volume (R$)
2008
36
41,93 bilhões / billion
2009
59
15,37 bilhões / billion
2010
19
52,29 bilhões / billion
2011
167
50,71 bilhões / billion
2012
248
89,99 bilhões / billion
2013
279
70,47 bilhões / billion
2014
288
75,25 bilhões / billion
2015
180
64,52 bilhões / billion
2016
175
60,59 bilhões / billion
2017
254
93,36 bilhões / billion
2018
434
148,24 bilhões / billion
Registros por setor Registrations X Sector
Financeiro / Financial
21,96%
Energia Elétrica / Power
18,22%
TI e Telecomunicações / IT and Telecommunication
10,42%
Emp. Adm. Participações / Holding Companies
8,68%
Metalurgia e Siderurgia / Steel and metallurgy
6,31%
Comércio e Indústria / Trade and Industry
4,70%
Transporte e Logística / Transport and Logistics
4,33%
Construção Civil / Civil Construction
3,78%
Outros / Others
3,60%
Comércio Varejista / Retail Trade
3,08%
Química e Petroquímica / Chemistry and Petrochemistry
2,72%
Saneamento / Sanitation
2,70%
Petróleo e Gás / Oil and Gas
1,71%
Seguradora / Insurance Company
1,56%
Destino das emissões Allocation of issues
Capital de Giro / Working capital
26,80%
Refinanciamento de passivo / Refinancing of liabilities
35,00%
Investimento em Infraestrutura / Investment in infrastructure
17,80%
Recompra ou Resgate de Debêntures de Emissão Anterior / Repurchase or redemption of previous debenture issues
9,40%
Investimento ou Aquisição de Participações Societárias / Investment in or acquisition of corporate holdings
8,40%
Não informado / Not informed
1,90%
Investimento em Imobilizado / Investment in fixed assets
0,70%
Fonte: CETIP – Elaboração: ANBIMA
Source: CETP – Elaboration: ANBIMA
Evolução dos FIDCs Development of the Credit Rights Investment Funds (FIDCs)
Ano / Year
No fundos / Number of funds
PL (milhões) / Shareholders equity (millions)
Variação do PL (%) / Variation in net worth (%)
Dez/12
392
64.607
-17,63
Dez/13
425
77.546
20,03
Dez/14
463
66.303
-14,50
Dez/15
552
74.548
12,43
Dez/16
617
86.824
30,95
Dez/17
728
102.878
55,16
Dez/18
920
122.754
64,66
Fonte: Anbid
Source: Anbid
Evolução dos Fundos de Ações Share Fund Development
Ano / Year
No fundos / Number of funds
PL (milhões) / Net worth (millions)
Variação do PL (%) / Variation in net worth (%)
Dez/12
1.963
202.561
11,61
Dez/13
2.127
205.990
1,69
Dez/14
2.071
176.333
-14,40
Dez/15
1.895
140.133
-20,53
Dez/16
1.750
150.238
7,21
Dez/17
1.851
227.916
51,70
Dez/18
2.024
307.980
35,13
Fonte: Anbid
Source: Anbid
28
