
Page 63 - Anuario Abrasca 19_20
P. 63
Investimentos Investments
Empresários voltam a investir após dois anos de retração
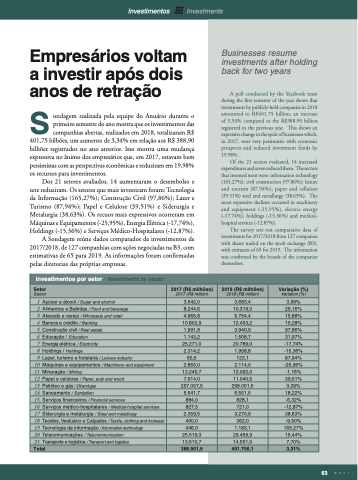
Sondagem realizada pela equipe do Anuário durante o primeiro semestre do ano mostra que os investimentos das companhias abertas, realizados em 2018, totalizaram R$ 401,75 bilhões, um aumento de 3,34% em relação aos R$ 388,90 bilhões registrados no ano anterior. Isso mostra uma mudança expressiva no ânimo dos empresários que, em 2017, estavam bem pessimistas com as perspectivas econômicas e reduziram em 19,98% os recursos para investimentos.
Dos 21 setores avaliados, 14 aumentaram o desembolso e sete reduziram. Os setores que mais investiram foram: Tecnologia da Informação (165,27%); Construção Civil (97,86%); Lazer e Turismo (87,94%); Papel e Celulose (39,51%) e Siderurgia e Metalurgia (38,63%). Os recuos mais expressivos ocorreram em Máquinas e Equipamentos (-25,95%), Energia Elétrica (-17,74%), Holdings (-15,36%) e Serviços Médico-Hospitalares (-12,87%).
A Sondagem reúne dados comparados de investimentos de 2017/2018, de 127 companhias com ações negociadas na B3, com estimativas de 65 para 2019. As informações foram confirmadas pelas diretorias das próprias empresas.
Businesses resume investments after holding back for two years
A poll conducted by the Yearbook team during the first semester of the year shows that investments by publicly-held companies in 2018 amounted to R$401.75 billion, an increase of 3.34% compared to the R$388.90 billion registered in the previous year. This shows an expressive change in the spirit of businesses which, in 2017, were very pessimistic with economic prospects and reduced investment funds by 19.98%.
Of the 21 sectors evaluated, 14 increased expenditures and seven reduced them. The sectors that invested most were: information technology (165.27%); civil construction (97.86%); leisure and tourism (87.94%); paper and cellulose (39.51%) steel and metallurgy (38.63%). The most expressive declines occurred in machinery and equipment (-25.95%), electric energy (-17.74%), holdings (-15.36%) and medical- hospital services (-12.87%).
The survey sets out comparative data of investments for 2017/2018 from 127 companies with shares traded on the stock exchange (B3), with estimates of 65 for 2019. The information was confirmed by the boards of the companies themselves.
Investimentos por setor Investments by sector
Setor 2017 (R$ milhões) 2018 (R$ milhões) Variação (%)
Sector 2017 (R$ million) 2018 (R$ million) Variation (%)
1 Açúcar e álcool / Sugar and alcohol 3.542,0
3.683,4 3,99%
2 Alimentos e Bebidas / Food and beverage 8.244,6
10.319,0 25,16%
3 Atacado e varejo / Wholesale and retail 4.965,8
4 Bancos e crédito / Banking 10.802,9
6 Educação / Education 1.143,2
5.754,4 15,88%
12.453,2 15,28%
5 Construção civil / Real estate 1.991,8
3.940,9 97,86%
1.508,7 31,97%
7 Energia elétrica / Electricity 25.271,0
20.789,0 -17,74%
8 Holdings / Holdings 2.314,2
1.958,8 -15,36%
9 Lazer, turismo e hotelaria / Leisure industry 65,5
123,1 87,94%
10 Máquinas e equipamentos / Machinery and equipment 2.855,0
13 Petróleo e gás / Oil and gas 257.057,5
2.114,0 -25,95%
11 Mineração / Mining 13.245,7
13.092,0 -1,16%
12 Papel e celulose / Paper, pulp and wood 7.914,0
11.040,6 39,51%
258.051,5 0,39%
14 Saneamento / Sanitation 5.541,7
6.551,5 18,22%
15 Serviços financeiros / Financial services 884,0
828,1 -6,32%
16 Serviços médico-hospitalares / Medical-hospital services 827,5
721,0 -12,87%
17 Siderurgia e metalurgia / Steel and metallurgy 2.359,5
3.270,9 38,63%
18 Tecidos, Vestuário e Calçados / Textile, clothing and footwear 400,0
362,0 -9,50%
19 Tecnologia da informação / Information technology 446,0
1.183,1 165,27%
20 Telecomunicações / Telecommunication 25.519,3
29.459,9 15,44%
21 Transporteelogística/Transportandlogistics 13.510,7
14.551,0 7,70%
Total 388.901,9
401.756,1 3,31%
63
