
Page 9 - ODJFS Human Trafficking Response Summary 2018-2019
P. 9
a detention home, local businesses, sexual assault service teams, and numerous other professionals and community partners.
Composite Human Trafficking Case Profile:
Now let us take a closer look at the results from the Ohio Human Trafficking Victim/ Survivor Survey. This survey has continued to collect comprehensive anonymized demographic information on children served - and alleged offenders when possible - as well as information regarding risk-factors, grooming tactics, and service provision. As with the previous year, these measures are extremely consistent over time and thus are likely to be fairly representative of actual trends among most cases throughout all eight quarters.
As an additional note, this data provides insights only into youth who are receiving referrals and services through CACs and can’t be considered representative for what the actual profile may be for youth trafficked in Ohio who remain under-identified. That being said the discrete but fairly consistent presence of special populations indicates that these populations are targeted but under-referred. With our current community assessment project it will soon be possible to compare these trafficking case profiles against the general community and environmental risk-factors.
Referrals for Service and Youth Served by CACs:
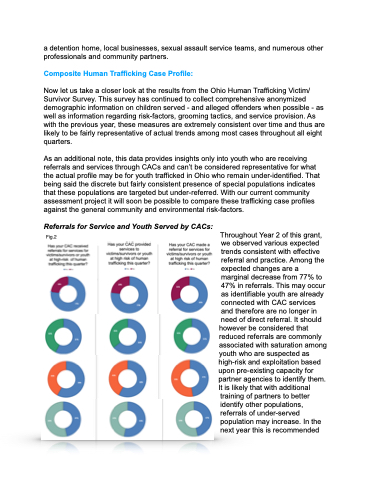
Fig.2
Throughout Year 2 of this grant, we observed various expected trends consistent with effective referral and practice. Among the expected changes are a marginal decrease from 77% to 47% in referrals. This may occur as identifiable youth are already connected with CAC services and therefore are no longer in need of direct referral. It should
however be considered that reduced referrals are commonly associated with saturation among youth who are suspected as high-risk and exploitation based upon pre-existing capacity for partner agencies to identify them. It is likely that with additional
training of partners to better identify other populations, referrals of under-served population may increase. In the next year this is recommended
