
Page 19 - ONCAC - Community Assessment Report 2020
P. 19
DISTRIBUTION OF CHILDREN SERVED BY CACS
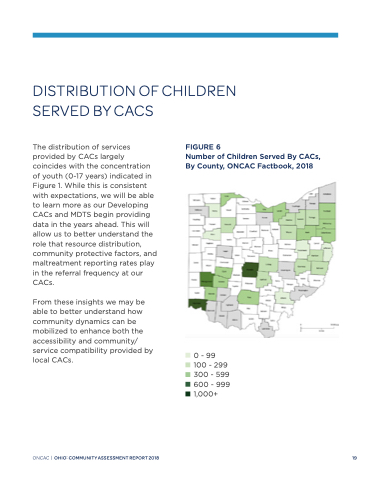
The distribution of services provided by CACs largely coincides with the concentration of youth (0-17 years) indicated in Figure 1. While this is consistent with expectations, we will be able to learn more as our Developing CACs and MDTS begin providing data in the years ahead. This will allow us to better understand the role that resource distribution, community protective factors, and maltreatment reporting rates play in the referral frequency at our CACs.
From these insights we may be able to better understand how community dynamics can be mobilized to enhance both the accessibility and community/ service compatibility provided by local CACs.
FIGURE 6
Number of Children Served By CACs, By County, ONCAC Factbook, 2018
ONCAC | OHIO:COMMUNITYASSESSMENTREPORT2018
19
0 - 99 100 - 299 300 - 599 600 - 999 1,000+
