
Page 8 - ONCAC - Community Assessment Report 2020
P. 8
Per Capita Income: $29,595,0561 Poverty Rate: 14%1
Children Living in Poverty: 22%3
Predominant Service Area2:
Rural (Less Than 20,000): 37% Suburban (20,000-100,000): 41% Urban (100,000 or More): 37% Multiple Counties: 22%
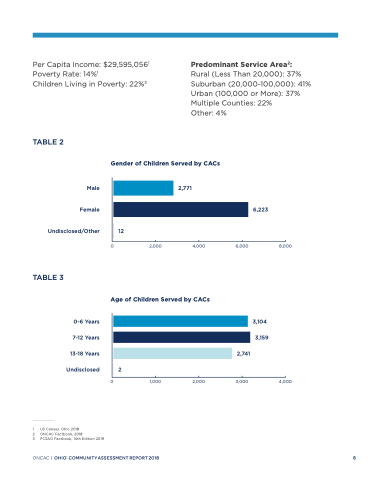
TABLE 2
Other: 4%
Gender of Children Served by CACs
Undisclosed/Other
12
TABLE 3
Male
Female
2,771
0
2,000
4,000
6,000
8,000
Age of Children Served by CACs
6,223
0-6 Years
7-12 Years
13-18 Years
Undisclosed
0
2
3,104 3,159
2,741
3,000
ONCAC | OHIO:COMMUNITYASSESSMENTREPORT2018
8
1,000
2,000
4,000
1 US Census: Ohio 2018
2 ONCAC Factbook, 2018
3 PCSAO Factbook, 14th Edition 2019
