
Page 3 - 116-502-1-PB_2
P. 3
Journal of Innovation in Educational and Cultural Research, 2022, 3(3), 397-404
The first step is an analysis that includes an analysis of the need to identify existing problems that
occur in class V IPA learning. After that, researchers conduct literature studies to find solutions to the
problem. After that, interviews and questionnaires are distributed to classroom teachers and students to
identify the required learning media. The second step is the analysis of needs (analyze); this stage is done to
know the needs of teachers and students for the development of media that will be done. Data from the
analysis of needs is then used to develop learning media. Need assessment through two activities: covering
the dissemination of questionnaires to teachers and students and interview activities to teachers and students.
At this stage, there is also an analysis of themes, sub-themes, essential competencies, indicators, learning
objectives, and appropriate teaching materials to develop environmental literacy skills.
The third step is designing media (design), including designing scenarios or learning activities that
follow the syllabus in elementary school, designing flowchart design, storyboards and materials to be
developed, and naming this media with "Water Learning Literacy." Moreover, there are also conducted for
determination of data collection techniques, research intrusions, and FGD with teachers, media experts, and
material experts. The selected material is in class V Theme 8 of Our Friends Environment. The fourth stage is
the development of media (develop). At this stage, researchers conduct activities to prepare water literacy
learning media that will be used by considering the theme or template used for images and answer choices.
Teaching materials are displayed audio-visually, making them more exciting and accessible for students to
understand learning.
The fifth step is implementation. At this stage, the learning media Water Learning Literacy is piloted
by using it in the learning process in the classroom. Done twice; Limited-scale trials and large-scale trials.
Students and teachers responded to the use of such learning media. If their responses are correct, then large-
scale trials can be conducted. Data on the development of environmental literacy is obtained from
questionnaires filled before and after learning using environmental literacy learning media. The last step is an
evaluation to determine if the product development has been fit for purpose. If it does not achieve the
expected goal, then the cycle at the previous stage can be repeated. At this evaluation stage, researchers
analyze the development of environmental literacy before and after using water literacy learning media. In
addition, the improvements made are based on responses from teachers and students. Evaluation of the
learning media development process is also carried out entirely.
Data Collection Instruments
The data in this study consists of validation results conducted by material and media experts
regarding the feasibility of refined products, responses to the use of water literacy learning media as a
learning medium shared with students and teachers, and questionnaires about student character discipline
and hard work. The data collection instrument used in the study was a questionnaire using the Likert scale.
The data obtained is quantified and used to determine the quality of IPS learning media, including the
product's feasibility and effectiveness.
Data Analysis
The data analysis technique in this study is carried out qualitatively and quantitatively. Qualitative
analysis is used to describe the process of product development until it is obtained in the form of learning
media that deserve to be tested extensively in real learning in school. Quality data is obtained from comments
and suggestions by media experts, material experts, teachers, and students. Meanwhile, quantitative data
analysis is used to describe product quality assessment based on the developed media's level of validity and
influence. The data used in quantitative analysis is obtained from the validation results of learning media by
material experts and media experts. The results of the media assessment questionnaire were analyzed using
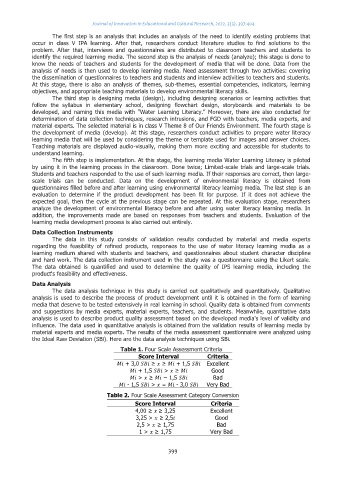
the Ideal Raw Deviation (SBi). Here are the data analysis techniques using SBi.
Table 1. Four Scale Assessment Criteria
Score Interval Criteria
+ 3,0 ≥ ≥ + 1,5 Excellent
+ 1,5 > ≥ Good
> ≥ − 1,5 Bad
- 1,5 > = - 3,0 Very Bad
Table 2. Four Scale Assessment Category Conversion
Score Interval Criteria
4,00 ≥ ≥ 3,25 Excellent
3,25 > ≥ 2,5 Good
2,5 > ≥ 1,75 Bad
1 > ≥ 1,75 Very Bad
399