
Page 31 - GE 10 Module Crim Midterm
P. 31
QUIRINO STATE UNIVERSITY
COLLEGE OF PUBLIC SAFETY
Bachelor of Science in Criminology
…harmonizing ideals
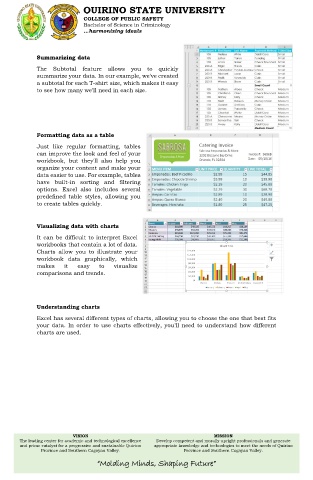
Summarizing data
The Subtotal feature allows you to quickly
summarize your data. In our example, we've created
a subtotal for each T-shirt size, which makes it easy
to see how many we'll need in each size.
Formatting data as a table
Just like regular formatting, tables
can improve the look and feel of your
workbook, but they'll also help you
organize your content and make your
data easier to use. For example, tables
have built-in sorting and filtering
options. Excel also includes several
predefined table styles, allowing you
to create tables quickly.
Visualizing data with charts
It can be difficult to interpret Excel
workbooks that contain a lot of data.
Charts allow you to illustrate your
workbook data graphically, which
makes it easy to visualize
comparisons and trends.
Understanding charts
Excel has several different types of charts, allowing you to choose the one that best fits
your data. In order to use charts effectively, you'll need to understand how different
charts are used.
VISION MISSION
The leading center for academic and technological excellence Develop competent and morally upright professionals and generate
and prime catalyst for a progressive and sustainable Quirino appropriate knowledge and technologies to meet the needs of Quirino
Province and Southern Cagayan Valley. Province and Southern Cagayan Valley.
“Molding Minds, Shaping Future”