
Page 12 - Guard II+ - Use Data Effectively
P. 12
ON-LINE MONITORING THE EFFICIENT WAY
The How?
400
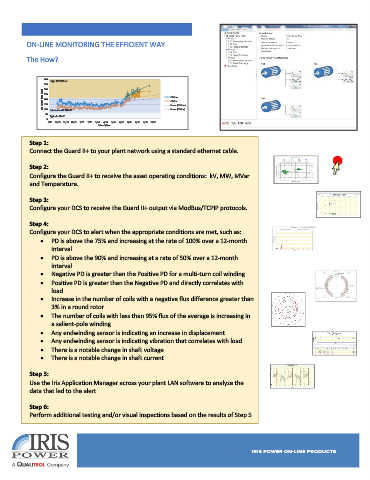
High 217-360mV
350
300
Peak Magnitude (mV) 250 C1 Qm+
200
C1 Qm-
150
Linear (C1 Qm+)
100
Moderate 62-316mV Linear (C1 Qm-)
50
Typical <62mV
0
9/15 10/15 11/15 12/15 1/16 2/16 3/16 4/16 5/16 6/16 7/16 8/16 9/16 10/16
Month/Year
Step 1:
Connect the Guard II+ to your plant network using a standard ethernet cable.
Step 2:
Configure the Guard II+ to receive the asset operating conditions: kV, MW, MVar
and Temperature.
Step 3:
Configure your DCS to receive the Guard II+ output via ModBus/TCPIP protocols.
Step 4:
Configure your DCS to alert when the appropriate conditions are met, such as:
• PD is above the 75% and increasing at the rate of 100% over a 12-month
interval
• PD is above the 90% and increasing at a rate of 50% over a 12-month
interval
• Negative PD is greater than the Positive PD for a multi-turn coil winding
• Positive PD is greater than the Negative PD and directly correlates with
load
• Increase in the number of coils with a negative flux difference greater than
3% in a round rotor
• The number of coils with less than 95% flux of the average is increasing in
a salient-pole winding
• Any endwinding sensor is indicating an increase in displacement
• Any endwinding sensor is indicating vibration that correlates with load
• There is a notable change in shaft voltage
• There is a notable change in shaft current
Step 5:
Use the Iris Application Manager across your plant LAN software to analyze the
data that led to the alert
Step 6:
Perform additional testing and/or visual inspections based on the results of Step 5