
Page 13 - Review Jurnal Internasional (Smirna Goni)
P. 13
Journal of Chemical Education Article
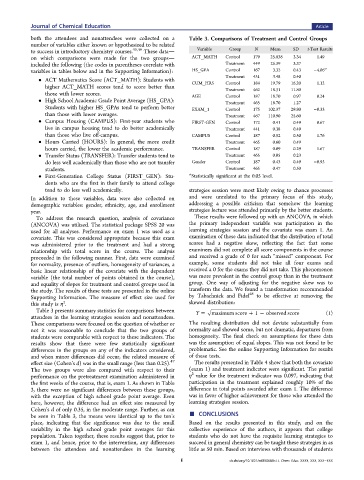
both the attendees and nonattendees were collected on a Table 3. Comparisons of Treatment and Control Groups
number of variables either known or hypothesized to be related
to success in introductory chemistry courses. 45,46 These data Variable Group N Mean SD t-Test Results
on which comparisons were made for the two groups ACT_MATH Control 179 25.838 3.34 1.49
included the following (the codes in parentheses correlate with Treatment 449 25.39 3.37
a
Control
HS_GPA
−4.06
167
3.32
0.43
variables in tables below and in the Supporting Information):
Treatment 431 3.48 0.40
• ACT Mathematics Score (ACT_MATH): Students with
CUM_HRS Control 184 19.79 16.20 1.12
higher ACT_MATH scores tend to score better than Treatment 462 18.31 11.80
those with lower scores.
AGE Control 187 18.70 0.97 0.24
• High School Academic Grade Point Average (HS_GPA):
Treatment 465 18.70 1.27
Students with higher HS_GPAs tend to perform better EXAM_1 Control 175 102.37 29.80 −0.33
than those with lower averages. Treatment 467 110.90 25.60
• Campus Housing (CAMPUS): First-year students who FIRST-GEN Control 172 0.41 0.49 0.67
live in campus housing tend to do better academically Treatment 441 0.38 0.49
than those who live off-campus. CAMPUS Control 187 0.52 0.50 1.76
• Hours Carried (HOURS): In general, the more credit Treatment 465 0.60 0.49
hours carried, the lower the academic performance. TRANSFER Control 187 0.09 0.29 1.67
• Transfer Status (TRANSFER): Transfer students tend to Treatment 465 0.05 0.23
do less well academically than those who are not transfer Gender Control 187 0.43 0.49 −0.95
students. Treatment 465 0.47 0.50
• First-Generation College Status (FIRST_GEN): Stu- a Statistically significant at the 0.05 level.
dents who are the first in their family to attend college
tend to do less well academically. strategies session were most likely owing to chance processes
In addition to these variables, data were also collected on and were unrelated to the primary focus of this study,
demographic variables: gender, ethnicity, age, and enrollment addressing a possible criticism that somehow the learning
year. strategies lecture was attended primarily by the better students.
To address the research question, analysis of covariance These results were followed up with an ANCOVA, in which
(ANCOVA) was utilized. The statistical package SPSS 20 was the primary independent variable was participation in the
used for all analyses. Performance on exam 1 was used as a learning strategies session and the covariate was exam 1. An
covariate. This was considered appropriate because this exam examination of these data indicated that the distribution of total
was administered prior to the treatment and had a strong scores had a negative skew, reflecting the fact that some
relationship with total score in the course. The analysis examinees did not complete all score components in the course
proceeded in the following manner. First, data were examined and received a grade of 0 for each “missed” component. For
for normality, presence of outliers, homogeneity of variances, a example, some students did not take all four exams and
basic linear relationship of the covariate with the dependent received a 0 for the exams they did not take. This phenomenon
variable (the total number of points obtained in the course), was more prevalent in the control group than in the treatment
and equality of slopes for treatment and control groups used in group. One way of adjusting for the negative skew was to
the study. The results of these tests are presented in the online transform the data. We found a transformation recommended
48
Supporting Information. The measure of effect size used for by Tabachnick and Fidel to be effective at removing the
2
this study is η . skewed distribution:
Table 3 presents summary statistics for comparisons between Y = maximum score + 1 − observed score (1)
attendees in the learning strategies session and nonattendees.
These comparisons were focused on the question of whether or The resulting distribution did not deviate substantially from
not it was reasonable to conclude that the two groups of normality and showed some, but not dramatic, departures from
students were comparable with respect to these indicators. The homogeneity. The final check on assumptions for these data
results show that there were few statistically significant was the assumption of equal slopes. This was not found to be
differences in the groups on any of the indicators considered, problematic. See the online Supporting Information for results
and when minor differences did occur, the related measure of of these tests.
effect size (Cohen’s d) was in the small range (less than 0.25). 47 The results presented in Table 4 show that both the covariate
The two groups were also compared with respect to their (exam 1) and treatment indicator were significant. The partial
2
performance on the pretreatment examination administered in η value for the treatment indicator was 0.097, indicating that
the first weeks of the course, that is, exam 1. As shown in Table participation in the treatment explained roughly 10% of the
3, there were no significant differences between these groups, difference in total points awarded after exam 1. The difference
with the exception of high school grade point average. Even was in favor of higher achievement for those who attended the
here, however, the difference had an effect size measured by learning strategies session.
be seen in Table 3, the means were identical up to the ten’s ■ CONCLUSIONS
Cohen’s d of only 0.35, in the moderate range. Further, as can
place, indicating that the significance was due to the small Based on the results presented in this study, and on the
variability in the high school grade point averages for this collective experience of the authors, it appears that college
population. Taken together, these results suggest that, prior to students who do not have the requisite learning strategies to
exam 1, and hence, prior to the intervention, any differences succeed in general chemistry can be taught these strategies in as
between the attendees and nonattendees in the learning little as 50 min. Based on interviews with thousands of students
E dx.doi.org/10.1021/ed300686h | J. Chem. Educ. XXXX, XXX, XXX−XXX