Page 3 - Microsoft PowerPoint - Powerpoint presentation
P. 3

2021‐22


                                                                                            2020‐21
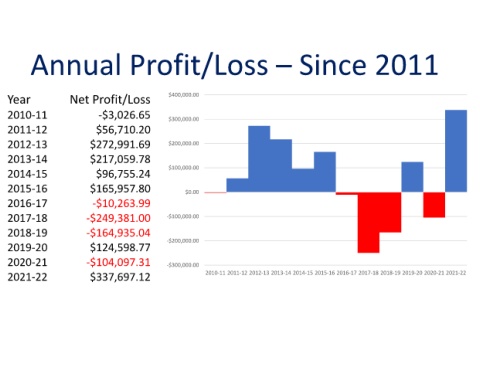
                          Annual Profit/Loss –Since 2011


                                                                                            2019‐20


                                                                                            2018‐19


                                                                                            2017‐18


                                                                                            2016‐17


                                                                                            2015‐16


                                                                                            2014‐15


                                                                                            2013‐14


                                                                                            2012‐13


                                                                                            2011‐12


                                                                                            2010‐11


                                 $400,000.00  $300,000.00  $200,000.00  $100,000.00  $0.00  ‐$100,000.00  ‐$200,000.00  ‐$300,000.00


                                   Net Profit/Loss  ‐$3,026.65  $56,710.20  $272,991.69  $217,059.78  $96,755.24  $165,957.80  ‐$10,263.99  ‐$249,381.00  ‐$164,935.04  $124,598.77  ‐$104,097.31  $337,697.12


                                   Year  2010‐11  2011‐12  2012‐13  2013‐14  2014‐15  2015‐16  2016‐17  2017‐18  2018‐19  2019‐20  2020‐21  2021‐22
   1   2   3   4   5   6   7   8