
Page 13 - PowerPoint Presentation
P. 13
Debugging configurations
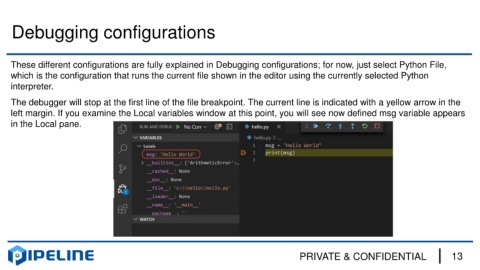
These different configurations are fully explained in Debugging configurations; for now, just select Python File,
which is the configuration that runs the current file shown in the editor using the currently selected Python
interpreter.
The debugger will stop at the first line of the file breakpoint. The current line is indicated with a yellow arrow in the
left margin. If you examine the Local variables window at this point, you will see now defined msg variable appears
in the Local pane.
PRIVATE & CONFIDENTIAL 13