


Page 38 - 70843_NSAA_SummerJournal2016
P. 38
Speakers brought up two important points related to           Figure 2. Highland Bike Park Retention
building the right skills park. Kevin Jordan, bike coordinator    of New Park Ready™ Riders
for Colorado’s Aspen Snowmass, said “...you can never have
enough dirt. You will always find ways to use what dirt you                 No Return                 1–3 Visits              3+ Visits
have, but there’s never enough (dirt) to do what you really
want to do.”                                                                2012        19 Riders                 2013                   117 Riders
                                                                                          3.39%                                            15.48%
    Chris Chmielewski, camps manager for Highland Bike
Parks, pointed out that if your skills park is built right, even                        98 Riders                               128 Riders
advanced riders will be able to use it to practice and refine                           17.47%                                    16.93%
skills as they seek to get better and better.
                                                                            444 Riders                            611 Riders
    Programming has proven to be one of the main driv-                        79.14%                                80.82%
ers of Highland’s success as it seeks to grow participation.
As owner Hayes points out, without growing the number of                  561 Riders Total                             756 Riders Total
people trying and enjoying downhill biking, there are only        20.86% Retention 117 Riders                  32.41% Retention 245 Riders
so many riders out there. By focusing on creating new riders
through its Find Your Ride program, Highland has devel-                     2014        24 Riders                 2015        40 Riders
oped fans of all ages, from young children to moms and                                    2.67%                                 3.03%
dads. In fact, Hayes has been able to show how his program-
ming model—including multiple lessons and a focus on                                     173 Riders               998 Riders  281 Riders
families—has increased retention in the customer base each                                 19.27%                   75.66%      21.3%
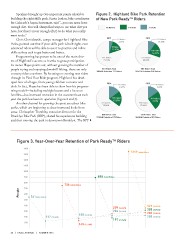
year the park has been in operation (figure 2 and 3).
                                                                         701 Riders                                   1319 Riders Total
    Another channel for growing the sport are urban bike                   78.06%                              24.34% Retention 321 Riders
parks, which are beginning to draw interested looks from
areas. Christopher Trombley, executive director for the                   898 Riders Total
Brooklyn Bike Park (BBP), shared his experiences building         21.94% Retention 197 Riders
and then moving the park in downtown Brooklyn. The BPP

Figure 3. Year-Over-Year Retention of Park Ready™ Riders

        1400                                                                                          1319 Initial Riders
        1300

        1200

        1100

        1000                                                      898 Initial Riders
        900

People  800 756 Initial Riders

        700

        600

              561Initial Riders

        500

        400                                    188 (33.51%)                             259 (34.26%)              321 (24.33%)
        300                                    145 (19.18%)                             204 (36.36%)              305 (33.96%)
                                                                                        197 (21.94%)              280 (37.04%)
        200 117 (20.86%)                                                                                          208 (37.07%)

        100

        Initial (I) 2012  2012       (I) 2013  2013               (I) 2014  2014                     (I) 2015     2015
36  |  NSAA JOURNAL  |  SUMMER 2016
                                                     Years

