Page 34 - Summer 2014
P. 34
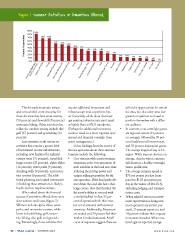
Figure 1. Summer Activities or Amenities Offered +*.( 3)&1 /,' 4.(&& *.* /,' / "132 !*0,*.& "./07 /41 &%%*.(2 &&3*.(2 $&.*$ *'3 *%&2 &23*5",2 /.$&132 /6.)*,, /4.3"*. *+*.( *2$ /,' %5&.341& "$&2 /0&2 )",,&.(& /412& ,0*.& ,*%& &/$"$)*.( "3&1 "1+ ,*-#*.( ",, /4.3"*. /"23&1 /4.3"*. *+*.( "-*,7 &4.*/.2 The ski area’s mountain terrain require additional investment and still niche opportunities for certain and vertical relief come into play for infrastructure tend to perform bet- ski areas, but that other areas face those ski areas that host cross country ter financially, while those that lever- greater competition and need to (50 percent) and downhill (46 percent) age existing infrastructure aren’t rated position themselves with a differ- mountain biking. Other activities that as highly from an ROI standpoint. ent audience. utilize the outdoor setting include disc (Perhaps the additional investment s In summer, most overnight guests golf (37 percent) and geocaching (12 tends to result in a more rigorous oper- are regional visitors (44 percent percent). ational and financial oversight from on average), followed by 39 per- Less common at ski resorts are resort management.) cent locals/second homeowners, activities that require a greater level Other findings from the survey of and 35 percent destination guests. of investment in new infrastructure, ski area operators about their summer The average length of stay is 2.6 including new facilities for ziplines/ business include the following: nights. While stays are shorter, on canopy tours (31 percent), ropes/chal- s One concern with certain summer average, than in winter, summer lenge courses (23 percent), alpine slides attractions is the over-saturation of still draws in a healthy overnight (12 percent), water parks (9 percent), such activities in the local area, thus visitor profile mix. climbing walls (9 percent), and moun- reducing the pricing power and s The average summer spend is tain coasters (8 percent). The addi- unique selling proposition for ski $76 per person per day (com- tional planning and capital investment area operators. If the local parks dis- pared to $102 per person per in building these attractions is likely a trict down the road also has a chal- day in the winter of 2012/13), hurdle to their implementation. lenge course, does that threaten the excluding lodging and transpor- When asked about the financial ski resort’s ability to succeed with tation costs. success of amenities offered, there were a similar facility? In fact, 35 per- s When asked if return on invest- clear winners and losers (figure 2). cent of operators think their mar- ment expectations is being met, Winners include alpine slides, water ket is not saturated with summer most operators say yes (61 per- parks, and mountain coasters, while amenities. Additionally, 36 percent cent), 25 percent report no, and losers include hiking, golf, moun- are neutral and 29 percent feel their 14 percent indicate their expecta- tain biking, disc golf, and geocach- market is indeed saturated. A bell tions were exceeded. When ana- ing. Interestingly, those activities that curve of responses suggests there are lyzed against reported average 32 | NSAA Journal | SUMMER 2014 w w w.nsaa. org NSAA Summer 2014 prepressed v6a.indd 32 7/3/14 4:20 PM