Page 16 - TB_6B
P. 16
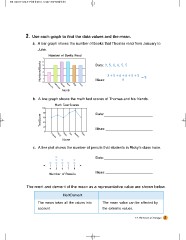
2 . Use each graph to find the data values and the mean.
a. A bar graph shows the number of books that Thomas read from January to
June.
NumberofBooks Number of Books Read Data: 3, 5, 6, 6, 5, 5
7 3 5 66 5 5 =5
6 Mean: 6
5
4
3
2
1
0
June
May
April
FMeabrcruhary
January
Month
b. A line graph shows the math test scores of Thomas and his friends.
TestScore Math Test Scores Data:
Mean:
100
80
60
40
20
0
Kate
Jessica
Ann
Ryan
Ricky
Thomas
Name
c. A line plot shows the number of pencils that students in Ricky’s class have.
Data:
45678 Mean:
Number of Pencils
The merit and demerit of the mean as a representative value are shown below.
MeritDemerit The mean value can be affected by
the extreme values.
The mean takes all the values into
account.
17. The Secret of Averages 5