Page 27 - PlayFacto Kids_3_10
P. 27
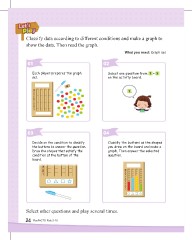
Classify data according to different conditions and make a graph to
show the data. Then read the graph.
What you need: Graph set
01 02
Each player prepares the graph Select one question from 1 ~ 3
set. on the activity board.
1 .
03 04
Decide on the condition to classify 02
the buttons to answer the question.
Draw the shapes that satisfy the Classify the buttons as the shapes
condition at the bottom of the you drew on the board and make a
board. graph. Then answer the selected
question.
Select other questions and play several times.
24 PlayFACTO Kids 3 - 10