
Page 439 - Atlas Sea Birds Ver1
P. 439
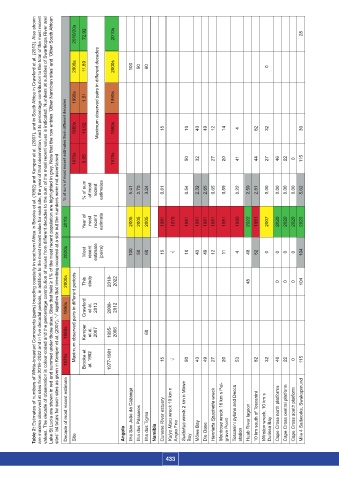
values. The decade of observation is colour-coded and the percentage contribution of values from different decades to the sum of the most recent values is indicated. Numbers at subsites of Swartkops River and
                         Lake St Lucia are shown in red and summed under those sites. Sites that held ≥ 1% of the most recent population are highlighted in grey. Note that the row entries ‘Other Namibian sites’ and ‘Other South African
                   Table 2: Estimates of numbers of White-breasted Cormorants (pairs) breeding coastally in southern Africa in Brooke et al. (1992) and Kemper et al. (2007), and in South Africa in Crawford et al. (2013). Also shown
                     are maxima observed at sites from 2018–2022 and in five decadal periods, in addition to the most recent value for each site, the year of that observation, and its percentage contribution to the total of the most recent
                                  2010/20s  72.92  2010s                                                         28

                                          Maximum observed pairs in different decades

                                  2000s  11.89   2000s  100  50  60                                  0


                                  1990s  1.51  1990s
                              % of sum of most recent estimates from different decades


                                  1980s  13.62  1980s           15       10  43  49  12  14  4   82  32          30


                                  1970s  0.05  1970s                     50  32     27  20  41   44  27  46  22  0  115
                           sites’ list totals for such sites as given in Kemper et al. (2007). ‘√’ signifies that breeding occurred at a site but the numbers were not ascertained


                                     % of sum   of most   recent   estimates     5.41  2.70  3.24  0.81     0.54  2.32  2.65  0.65  0.59  0.22  2.59  2.81  0.00  0.00  0.00  0.00  5.62


                              2010s  Year of   most   recent   estimate  2005  2005  2005  1981  1979  1981  1981  1981  1981  1981  1980  2022  1981  2007  2020  2020  2020  2020


                               2020s  Most   recent   estimate   (pairs)  100  50  60  15  √  10  43  49  12  11  4  48  52  0  0  0  0  104


                               2000s  This   study  2018-  2022                                         48            0  0  0  104


                               1990s Maximum observed pairs in different periods  Crawford   et al.   2013  2008-  2012


                               1980s  Kemper   et al.   2007  1995-  2006  60


                               1970s  Brooke et    al. 1982  1977-1981  15  √  50  43  49  27  20  53  82  32  46  22  0  115


                               Decade of most recent estimate  Ilha Sao João da Cazanga  Ilha dos Pássaros  Ilha dos Tigres  Namibia  Cunene River estuary  Kaiyo Maru wreck 10 km n   Angra Fria  Suidekus wreck 2 km n Möwe   Möwe Bay  Die Oase  Henrietta Spachette wreck  Montrose wreck 16 km s Pal-  grave Point  Toscanini pylons and Decca   Huab River lagoon  10 km south of Toscanini  Winston wreck, 10 km s   Durissa Bay  Cape Cross north platforms  Cape Cross central platform  Cape Cross south platform Mile 4 Saltw


                                                   Angola
                                  Site


                                                                 433      Bay               station