
Page 8 - TouchBase Winter 2021/22
P. 8
New Metrics analysis section
New Family Size chart which shows families by the number of applications indicating the most active families in the result set.
01 02 03
New Pending chart which shows families by the number of pending applications. Identify the most active families with the most pending applications.
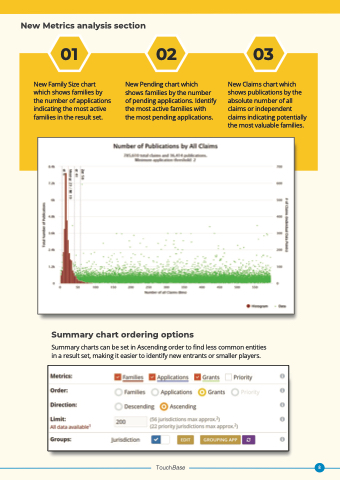
New Claims chart which shows publications by the absolute number of all claims or independent claims indicating potentially the most valuable families.
Summary chart ordering options
Summary charts can be set in Ascending order to find less common entities in a result set, making it easier to identify new entrants or smaller players.
TouchBase 8
