
Page 2 - RCS-2015-AnnualReport-Page 1_Final
P. 2
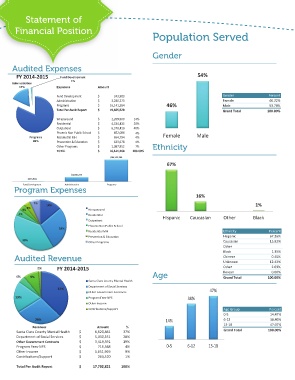
Statement of Population Served
Financial Position
Gender
Audited Expenses 54%
FY 2014-2015 Fund Development Amount
1%
Administration
17% Expenses
Fund Development $ 243,983 46% Gender Percent
Administration $ 3,280,273 Female 46.22%
Programs $ 16,141,264 Male 53.78%
Total Per Audit Report $ 19,665,520 Grand Total 100.00%
Programs Wraparound $ 2,209,909 14% Female Male 1%
82% Residential $ 4,534,435 28% Black
Outpatient $ 6,378,410 40% Ethnicity
Phoenix Non Public School $ Percent
Residential MH $ 652,086 4% 67.26%
Prevention & Education $ 654,794 4% 15.82%
Other Programs $ 623,678 4% 1.35%
TOTAL $ 1,087,952 7% 0.45%
16,141,264 100.00% 12.43%
2.69%
$16,141,264 0.00%
100.00%
67%
Percent
$3,280,273 14.47%
38.46%
$243,983 47.07%
100.00%
Fund Development Administration Programs
Program Expenses
16%
7% 14%
4% 4% Wraparound Hispanic Caucasian Other
4% Residential
Outpatient
28% Phoenix Non Public School Ethnicity
39% Residential MH Hispanic
Prevention & Education Caucasian
Other Programs Other
Black
Audited Revenue Chinese
Unknown
2% FY 2014-2015 Age Other
4% 9% Korean
Santa Clara County Mental Health
19% Department of Social Services Grand Total
Other Government Contracts
37% Program Fees-NPS 47%
Other Income 38%
Contributions/Support
Age Group
29% $ Amount % 0-5
$ 6,620,861 37%
Revenues $ 5,030,351 28% 14% 6-12
Santa Clara County Mental Health $ 3,419,591 19%
Department of Social Services $ 13-18
Other Government Contracts $ 716,568 4% Grand Total
Program Fees-NPS 1,651,929 9%
Other Income $ 1% 0-5 6-12 13-18
Contributions/Support 263,520
100%
Total Per Audit Report 17,702,821