
Page 29 - GBC winter issue ENG 2019
P. 29
RESEARCH REPORT
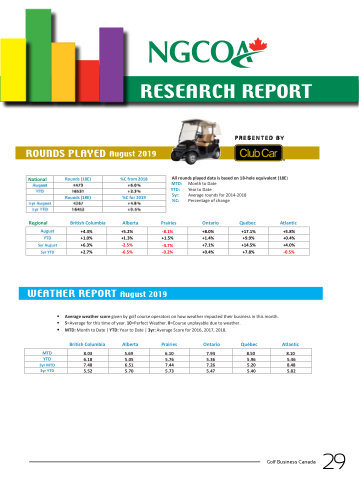
ROUNDS PLAYED August 2019
PRESENTED BY
All rounds played data is based on 18-hole equivalent (18E) MTD: Month to Date
National
Rounds (18E)
%C from 2018
Rounds (18E)
%C for 2019
Regional
British Columbia
Alberta
YTD: Year to Date
5yr: Average rounds for 2014-2018 %C: Percentage of change
Prairies Ontario Québec
Atlantic
August
+4.3%
+5.2%
-8.1%
+8.0%
+17.1%
+5.8%
YTD
+1.0%
+1.3%
+1.5%
+1.4%
+9.9%
+0.4%
5yr August
+6.3%
-2.5%
-4.7%
+7.1%
+14.5%
+4.0%
5yr YTD
+2.7%
-6.5%
-0.2%
+0.4%
+7.8%
-0.5%
WEATHER REPORT August 2019
▪ Average weather score given by golf course operators on how weather impacted their business in this month. ▪ 5=Average for this time of year. 10=Perfect Weather. 0=Course unplayable due to weather.
▪ MTD: Month to Date | YTD: Year to Date | 3yr: Average Score for 2016, 2017, 2018.
British Columbia Alberta Prairies Ontario Québec
Atlantic
MTD
8.03
5.69
6.10
7.94
8.50
8.10
YTD
6.18
5.05
5.76
5.36
5.96
5.46
3yr MTD
7.48
6.51
7.44
7.26
5.20
8.48
3yr YTD
5.52
5.70
5.73
5.47
5.40
5.82
Golf Business Canada
29
