Page 3 - Q2 Mar Vista
P. 3

AVERAGE DOM                        SOLD PRICE VS LIST PRICE            NUMBER OF HOMES SOLD
            The MLS froze the days on market   On average, properties sold for     A significant 41.76% less homes
            during COVID so these numbers do   less than their list price in 2020   sold in Q2 2020 than Q2 2019.
            not reflect the actual days spent on   reflecting a 0.5% decrease from   2019 - 91
            the market.                        that of Q2 2019.                    2020 - 53
            2019 - 44                          2019 - 99.2%                        Up 23.61%
            2020 - 14                          2020 - 98.7%


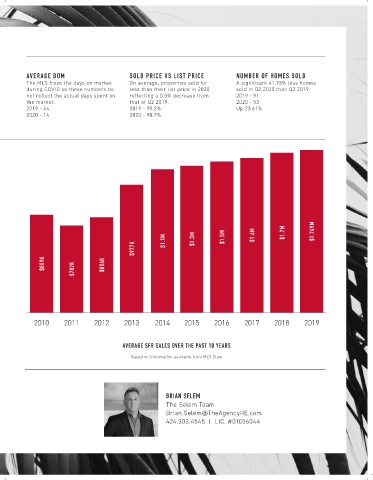
                                                           $1.1M     $1.3M     $1.5M     $1.6M      $1.7M     $1.749M
                                                 $977K


                  $809K     $782K      $806K


               2010      2011      2012      2013       2014      2015      2016      2017      2018      2019


                                             AVERAGE SFR SALES OVER THE PAST 10 YEARS
                                                Based on information available from MLS Claw


                                                            BRIAN SELEM
                                                            The Selem Team
                                                            Brian.Selem@TheAgencyRE.com
                                                            424.303.4545  I  LIC. #01056044
   1   2   3   4