
Page 3 - Q3 Brentwood Market Update 2020
P. 3
V
L
AVERAGE DOM SOLD PRICE S IST PRICE NUMBER OF HOMES SOLD
The MLS froze the days on market Homes sold for a fraction More homes sold in Q3
during COVID lockdown so these less than list price in 2020 as 2020 than Q3 2019.
numbers do not reflect the actual compared to 2019. 2019 - 72
days spent on the market. 2019 - 95.7% 2020 - 96
2019 - 82 2020 - 95.5% Up 33.33%
2020 - 32
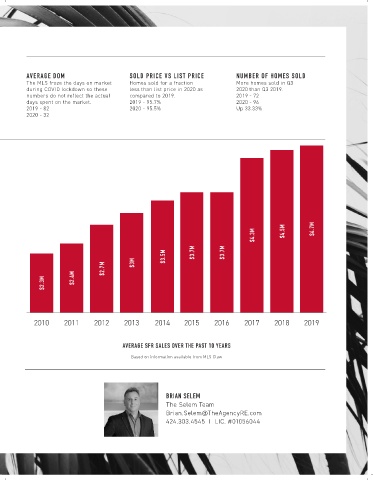
$4.3M $4.5M $4.7M
$3.5M $3.7M $3.7M
$3M
$2.7M
$2.3M $2.4M
2010 2011 2012 2013 2014 2015 2016 2017 2018 2019
AVERAGE SFR SALES OVER THE PAST 10 YEARS
Based on information available from MLS Claw
BRIAN SELEM
The Selem Team
Brian.Selem@TheAgencyRE.com
424.303.4545 I LIC. #01056044