
Page 20 - PMAA Catalogue Final
P. 20
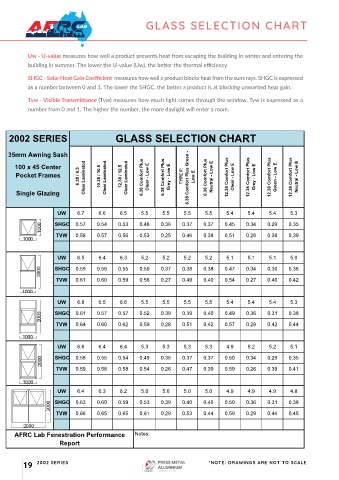
GLASS SELECTION CHART


           Uw - U-value measures how well a product prevents heat from escaping the building in winter and entering the
           building in summer. The lower the U-value (Uw), the better the thermal efficiency

           SHGC - Solar Heat Gain Coefficient, measures how well a product blocks heat from the suns rays. SHGC is expressed
           as a number between 0 and 1. The lower the SHGC, the better a product is at blocking unwanted heat gain.

           Tvw - Visible Transmittance (Tvw) measures how much light comes through the window. Tvw is expressed as a
                             6.38 / 6.5                                                           10.38 / 10.5                                                          12.38 / 12.5                                                     6.38 Comfort Plus                                                            6.38 Comfort Plus                                                      6.38 Comfort Plus                                                         12.38 Comfort Plus
           number from 0 and 1. The higher the number, the more daylight will enter a room.


    2002 SERIES                           GLASS SELECTION CHART


    35mm Awning Sash                                             TYPE F:                                 12.38 Comfort Plus

      100 x 45 Center
       Pocket Frames           Clear Laminated  Clear Laminated  Clear Laminated  Clear - Low E  Grey - Low E  6.38 Comfort Plus Green -   Low E  Neutral - Low E  Clear - Low E  Grey - Low E  Green - Low E  Neutral - Low E

       Single Glazing


                     UW     6.7     6.6    6.5     5.5    5.5     5.5    5.5     5.4    5.4    5.4     5.3
                    SHGC    0.57   0.54    0.53   0.48    0.36   0.37   0.37    0.45   0.34    0.29   0.35

                     TVW    0.58   0.57    0.56   0.53    0.25   0.46   0.38    0.51   0.26    0.38   0.39


                     UW     6.5     6.4    6.3     5.2    5.2     5.2    5.2     5.1    5.1    5.1     5.0
                    SHGC    0.59   0.56    0.55   0.50    0.37   0.38   0.38    0.47   0.34    0.30   0.36
                     TVW    0.61   0.60    0.59   0.56    0.27   0.49   0.40    0.54   0.27    0.40   0.42


                     UW     6.8     6.5    6.6     5.5    5.5     5.5    5.5     5.4    5.4    5.4     5.3

                    SHGC    0.61   0.57    0.57   0.52    0.39   0.39   0.40    0.49   0.36    0.31   0.38
                     TVW    0.64   0.60    0.62   0.59    0.28   0.51   0.42    0.57   0.28    0.42   0.44


                     UW     6.6     6.4    6.4     5.3    5.3     5.3    5.3     4.9    5.2    5.2     5.1

                    SHGC    0.58   0.55    0.54   0.49    0.36   0.37   0.37    0.50   0.34    0.29   0.35
                     TVW    0.59   0.58    0.58   0.54    0.26   0.47   0.39    0.59   0.26    0.39   0.41


                     UW     6.4     6.3    6.2     5.0    5.0     5.0    5.0     4.9    4.9    4.9     4.8
                    SHGC    0.63   0.60    0.59   0.53    0.39   0.40   0.40    0.50   0.36    0.31   0.38

                     TVW    0.66   0.65    0.65   0.61    0.29   0.53   0.44    0.59   0.29    0.44   0.45


      AFRC Lab Fenestration Performance         Notes:
                      Report


         19   2002 SERIES                                                 *NOTE: DRAWINGS ARE NOT TO SCALE