
Page 106 - Resources and Support for the Online Educator
P. 106
the ISTE Standards for Students with the use and creation of infographics. As
students create, they must decide which tool will enable them to represent data,
display information, show ideas, explain concepts, and present to a variety of
audiences while building digital citizenship skills through respectful and re-
sponsible use of digital tools. Students can work collaboratively with peers or on
a global scale to create infographics and share their learning.
Using infographic tools, students can design graphics that are creative, in-
dividualized, and demonstrative of their learning. The variety of fonts, themes,
images, and other features within the creation tools enhance visual thinking
skills and spark curiosity for learning. In my classroom, we have used sever-
al tools for creating infographics, including Adobe Spark (spark.adobe.com),
Buncee (app.edu.buncee.com), Canva (canva.com), Piktochart (piktochart.com),
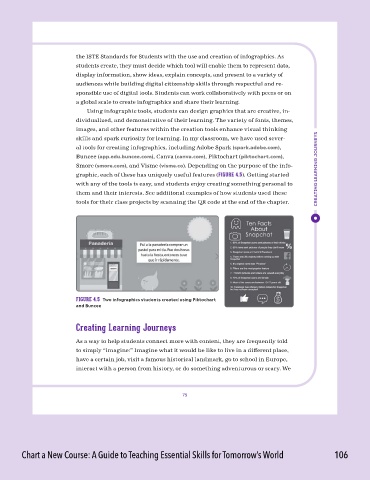
Smore (smore.com), and Visme (visme.co). Depending on the purpose of the info- CreatIng LearnIng JourneYS
graphic, each of these has uniquely useful features (FIGURE 4.5). Getting started
with any of the tools is easy, and students enjoy creating something personal to
them and their interests. See additional examples of how students used these
tools for their class projects by scanning the QR code at the end of the chapter.
FIGURE 4.5 two infographics students created using piktochart
and Buncee
Creating Learning Journeys
As a way to help students connect more with content, they are frequently told
to simply “imagine:” Imagine what it would be like to live in a different place,
have a certain job, visit a famous historical landmark, go to school in Europe,
interact with a person from history, or do something adventurous or scary. We
75
Chart a New Course: A Guide to Teaching Essential Skills for Tomorrow’s World 106