
Page 133 - OMIICOT2020_SESSION2
P. 133
Zamila Abu Zainal / JOJAPS – JOURNAL ONLINE JARINGAN PENGAJIAN SENI BINA 0194955501
Diagram 2 Pie chart shows the percentage of element in designing wearable design technology
Diagram 3 Pie chart shows the percentage of material used in designing a wearable design technology
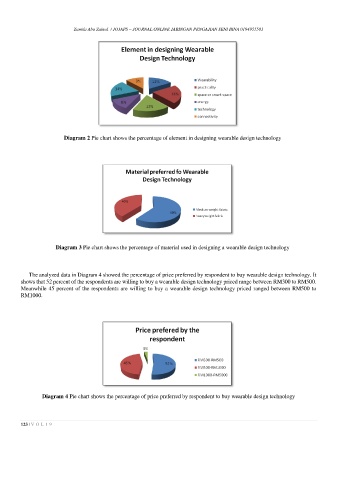
The analyzed data in Diagram 4 showed the percentage of price preferred by respondent to buy wearable design technology. It
shows that 52 percent of the respondents are willing to buy a wearable design technology priced range between RM300 to RM500.
Meanwhile 45 percent of the respondents are willing to buy a wearable design technology priced ranged between RM500 to
RM1000.
Diagram 4 Pie chart shows the percentage of price preferred by respondent to buy wearable design technology
123 | V O L 1 9