
Page 27 - JOJAPS_VOL13
P. 27
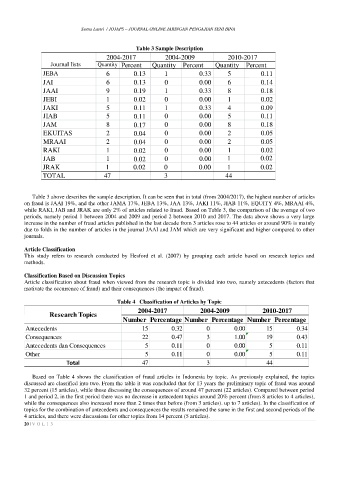
Surna Lastri  / JOJAPS – JOURNAL ONLINE JARINGAN PENGAJIAN SENI BINA

                                                 Table 3 Sample Description
                                      2004 - 2017          2004 - 2009           2010 - 2017
                   Journal lists      Quantity    P ercent      Quantity       Pe rcent      Qua ntity      Per cent
                JEBA                  6                    1           0.33      5           0.11
                                                0.13
                                                0.13
                JAI                   6                    0           0.00      6           0.14
                JAAI                  9                    1           0.33      8           0.18
                                                0.19
                                                0.02
                JEBI                  1                    0           0.00      1           0.02
                JAKI                  5                    1           0.33      4           0.09
                                                0.11
                JIAB                  5                    0           0.00      5           0.11
                                                0.11
                JAM                   8                    0           0.00      8           0.18
                                                0.17
                EKUITAS               2                    0           0.00      2           0.05
                                                0.04
                MRAAI                 2                    0           0.00      2           0.05
                                                0.04
                RAKI                  1                    0           0.00      1           0.02
                                                0.02
                JAB                   1                    0           0.00      1           0.02
                                                0.02
                JRAK                  1                    0           0.00      1           0.02
                                                0.02
                TOTAL                 47                   3                    44


            Table 3 above describes the sample description. It can be seen that in total (from 2004/2017), the highest number of articles
          on fraud is JAAI 19%, and the other JAMA 17%, JEBA 13%, JAA 13%, JAKI 11%, JIAB 11%, EQUITY 4%, MRAAI 4%,
          while RAKI, JAB and JRAK are only 2% of articles related to fraud. Based on Table 3, the comparison of the average of two
          periods, namely period 1 between 2004 and 2009 and period 2 between 2010 and 2017. The data above shows a very large
          increase in the number of fraud articles published in the last decade from 3 articles rose to 44 articles or around 90% is mainly
          due to folds in the number of articles in the journal JAAI and JAM which are very significant and higher compared to other
          journals.

          Article Classification
          This  study  refers  to  research  conducted  by  Hesford  et  al.  (2007)  by  grouping  each  article  based  on  research  topics  and
          methods.

          Classification Based on Discussion Topics
          Article classification about fraud when viewed from the research topic is divided into two, namely antecedents (factors that
          motivate the occurrence of fraud) and their consequences (the impact of fraud).

                                          Table 4   Classification of Articles by Topic
                                                 2004-2017             2004-2009             2010-2017
                  Research Topics
                                            Number Percentage Number Percentage Number Percentage
          Antecedents                              15        0.32         0        0.00        15        0.34
          Consequences                             22        0.47         3        1.00        19        0.43
          Antecedents dan Consequences              5        0.11         0        0.00         5        0.11
          Other                                     5        0.11         0        0.00         5        0.11
                        Total                      47                     3                    44

            Based  on  Table  4  shows  the  classification  of  fraud  articles  in  Indonesia  by  topic.  As  previously  explained,  the  topics
          discussed are classified into two. From the table it was concluded that for 13 years the preliminary topic of fraud was around
          32 percent (15 articles), while those discussing the consequences of around 47 percent (22 articles). Compared between period
          1 and period 2, in the first period there was no decrease in antecedent topics around 20% percent (from 8 articles to 4 articles),
          while the consequences also increased more than 2 times than before (from 3 articles). up to 7 articles). In the classification of
          topics for the combination of antecedents and consequences the results remained the same in the first and second periods of the
          4 articles, and there were discussions for other topics from 14 percent (5 articles).
          20 | V O L 1 3