
Page 57 - JOJAPS_VOL15
P. 57
JOJAPS
eISSN 2504-8457
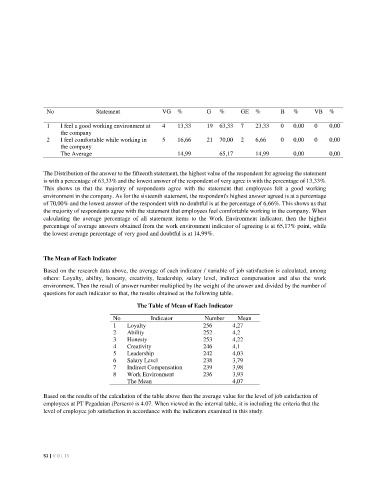
No Statement VG % G % GE % B % VB %
1 I feel a good working environment at 4 13,33 19 63,33 7 23,33 0 0,00 0 0,00
the company
2 I feel comfortable while working in 5 16,66 21 70,00 2 6,66 0 0,00 0 0,00
the company
The Average 14,99 65,17 14,99 0,00 0,00
The Distribution of the answer to the fifteenth statement, the highest value of the respondent for agreeing the statement
is with a percentage of 63,33% and the lowest answer of the respondent of very agree is with the percentage of 13,33%.
This shows us that the majority of respondents agree with the statement that employees felt a good working
environment in the company. As for the sixteenth statement, the respondent's highest answer agreed is at a percentage
of 70,00% and the lowest answer of the respondent with no doubtful is at the percentage of 6,66%. This shows us that
the majority of respondents agree with the statement that employees feel comfortable working in the company. When
calculating the average percentage of all statement items to the Work Environment indicator, then the highest
percentage of average answers obtained from the work environment indicator of agreeing is at 65,17% point, while
the lowest average percentage of very good and doubtful is at 14,99%.
The Mean of Each Indicator
Based on the research data above, the average of each indicator / variable of job satisfaction is calculated, among
others: Loyalty, ability, honesty, creativity, leadership, salary level, indirect compensation and also the work
environment. Then the result of answer number multiplied by the weight of the answer and divided by the number of
questions for each indicator so that, the results obtained as the following table.
The Table of Mean of Each Indicator
No Indicator Number Mean
1 Loyalty 256 4,27
2 Ability 252 4,2
3 Honesty 253 4,22
4 Creativity 246 4,1
5 Leadership 242 4,03
6 Salary Level 238 3,79
7 Indirect Compensation 239 3,98
8 Work Environment 236 3,93
The Mean 4,07
Based on the results of the calculation of the table above then the average value for the level of job satisfaction of
employees at PT Pegadaian (Persero) is 4.07. When viewed in the interval table, it is including the criteria that the
level of employee job satisfaction in accordance with the indicators examined in this study.
51 | V O L 15