
Page 36 - J0JAPS_VOL14
P. 36
Chew Ing Ming / JOJAPS – JOURNAL ONLINE JARINGAN PENGAJIAN SENI BINA 0194955501
(a) (b)
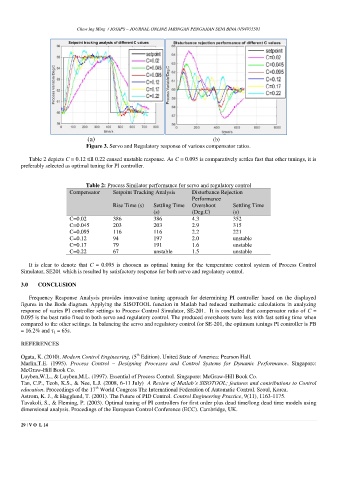
Figure 3. Servo and Regulatory response of various compensator ratios.
Table 2 depicts C = 0.12 till 0.22 caused unstable response. As C = 0.095 is comparatively settles fast that other tunings, it is
preferably selected as optimal tuning for PI controller.
Table 2: Process Similator performance for servo and regulatory control
Compensator Setpoint Tracking Analysis Disturbance Rejection
Performance
Rise Time (s) Settling Time Overshoot Settling Time
(s) (Deg.C) (s)
C=0.02 386 386 4.3 352
C=0.045 203 203 2.9 315
C=0.095 116 116 2.2 221
C=0.12 94 197 2.0 unstable
C=0.17 79 191 1.6 unstable
C=0.22 67 unstable 1.5 unstable
It is clear to denote that C = 0.095 is choosen as optimal tuning for the temperature control system of Process Control
Simulator, SE201 which is resulted by satisfactory response for both servo and regulatory control.
3.0 CONCLUSION
Frequency Response Analysis provides innovative tuning approach for determining PI controller based on the displayed
figures in the Bode diagram. Applying the SISOTOOL function in Matlab had reduced mathematic calculations in analyzing
response of varies PI controller settings to Process Control Simulator, SE-201. It is concluded that compensator ratio of C =
0.095 is the best ratio fixed to both servo and regulatory control. The produced overshoots were less with fast setting time when
compared to the other settings. In balancing the servo and regulatory control for SE-201, the optimum tunings PI controller is PB
= 16.2% and = 65s.
REFERENCES
th
Ogata, K. (2010). Modern Control Engineering, (5 Edition). United State of America: Pearson Hall.
Marlin,T.E. (1995). Process Control – Designing Processes and Control Systems for Dynamic Performance. Singapore:
McGraw-Hill Book Co.
Luyben,W.L., & Luyben,M.L. (1997). Essential of Process Control. Singapore: McGraw-Hill Book Co.
Tan, C.P., Teoh, K.S., & Nee, L.J. (2008, 6-11 July) A Review of Matlab’s SISOTOOL; features and contributions to Control
th
education. Proceedings of the 17 World Congress The International Federation of Automatic Control. Seoul, Korea.
Astrom, K. J., & Hagglund, T. (2001). The Future of PID Control. Control Engineering Practice, 9(11), 1163-1175.
Tavakoli, S., & Fleming, P. (2003). Optimal tuning of PI controllers for first order plus dead time/long dead time models using
dimensional analysis. Procedings of the European Control Conference (ECC). Cambridge, UK.
29 | V O L 14