
Page 62 - J0JAPS_VOL14
P. 62
Aeida Nurhafidzah / JOJAPS – JOURNAL ONLINE JARINGAN PENGAJIAN SENI BINA 0194955501
Additionally, modifying the classroom environment may serve as a direct intervention for children who demonstrate ongoing
disruptive behavior (Conroy, Davis, Fox, and Brown, 2002). Although the well-designed classroom has proven benefits, there is
little research on the impact environmental modifications have on behavior and learning (Guardino, 2009; Schilling & Shwartz,
2004.
3.0 RESEARCH DESIGN AND METHODOLOGY
This study deployed a survey method to obtain data. The questionnaire instrument contained two sections which was adapted
from (Pat, n.d.). The first section focused on obtaining respondents’ demographic profiles such as age, semester, gender and
department of the students. The second section consists of 21 items of two mainly focussed variables which are the classroom
physical appearance and classroom environment. For these 21 statements, this study used a 4-points Likert scale of 1 for
“strongly agree” to 4 for “strongly disagree”. The questionnaire was developed in English.
The authors have personally distributed the questionnaires randomly to 338 students of Polytechnic Mukah in July 2017. The
sample was taken according to the Table for Determining Sample Size from a given Population by Krejcie and Morgan (1970),
according to Mukah Polytechnic students’ population in June 2017 Session at 2746 students. This study utilized a few common
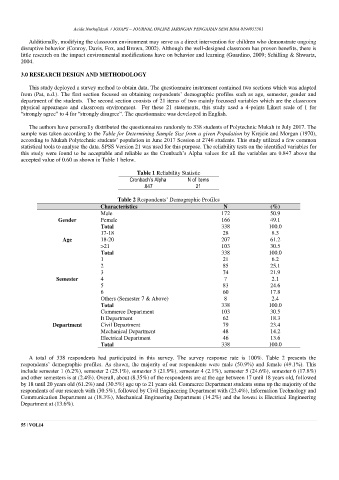
statistical tools to analyse the data. SPSS Version 21 was used for this purpose. The reliability tests on the identified variables for
this study were found to be acceptable and reliable as the Cronbach’s Alpha values for all the variables are 0.847 above the
accepted value of 0.60 as shown in Table 1 below.
Table 1 Reliability Statistic
Cronbach’s Alpha N of Items
.847 21
Table 2 Respondents’ Demographic Profiles
Characteristics N (%)
Male 172 50.9
Gender Female 166 49.1
Total 338 100.0
17-18 28 8.3
Age 18-20 207 61.2
>21 103 30.5
Total 338 100.0
1 21 6.2
2 85 25.1
3 74 21.9
Semester 4 7 2.1
5 83 24.6
6 60 17.8
Others (Semester 7 & Above) 8 2.4
Total 338 100.0
Commerce Department 103 30.5
It Department 62 18.3
Department Civil Department 79 23.4
Mechanical Department 48 14.2
Electrical Department 46 13.6
Total 338 100.0
A total of 338 respondents had participated in this survey. The survey response rate is 100%. Table 2 presents the
respondents’ demographic profiles. As shown, the majority of our respondents were male (50.9%) and female (49.1%). This
include semester 1 (6.2%), semester 2 (25.1%), semester 3 (21.9%), semester 4 (2.1%), semester 5 (24.6%), semester 6 (17.8%)
and other semesters is at (2.4%). Overall, about (8.35%) of the respondents are at the age between 17 until 18 years old, followed
by 18 until 20 years old (61.2%) and (30.5%) age up to 21 years old. Commerce Department students sums up the majority of the
respondents of our research with (30.5%), followed by Civil Engineering Department with (23.4%), Information Technology and
Communication Department at (18.3%), Mechanical Engineering Department (14.2%) and the lowest is Electrical Engineering
Department at (13.6%).
55 | VOL14