Page 127 - read
P. 127

Nora Ismail / JOJAPS – JOURNAL ONLINE JARINGAN PENGAJIAN SENI BINA 01132555145


                                   5
                                 4.5
                                   4
                                 3.5
                                   3
                        NITROGEN  2.5
                        CONTENT
                        (%)        2
                                 1.5
                                   1
                                 0.5
                                   0
                                          1        2         3         4        5         6
                                                 NO SAMPLE
                                                                                NITROGEN (%)


                                  Figure 5: Comparison between nitrogen content (%) and sample.
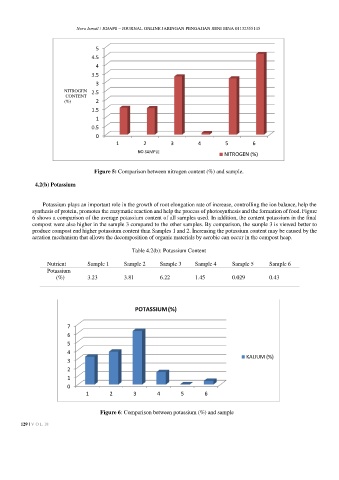
             4.2(b) Potassium


                Potassium plays an important role in the growth of root elongation rate of increase, controlling the ion balance, help the
            synthesis of protein, promotes the enzymatic reaction and help the process of photosynthesis and the formation of food. Figure
            6 shows a comparison of the average potassium content of all samples used. In addition, the content potassium in the final
            compost were also higher in the sample 3 compared to the other samples. By comparison, the sample 3 is viewed better to
            produce compost end higher potassium content than Samples 1 and 2. Increasing the potassium content may be caused by the
            aeration mechanism that allows the decomposition of organic materials by aerobic can occur in the compost heap.

                                               Table 4.2(b): Potassium Content

                  Nutrient      Sample 1     Sample 2    Sample 3     Sample 4     Sample 5     Sample 6
                  Potassium
                     (%)        3.23         3.81        6.22         1.45         0.029        0.43


                                                POTASSIUM (%)


                         7
                         6
                         5
                         4
                                                                                        KALIUM (%)
                         3
                         2
                         1
                         0
                               1        2       3       4        5       6


                                    Figure 6: Comparison between potassium (%) and sample

          129 | V O L 18
   122   123   124   125   126   127   128   129   130   131   132