
Page 97 - read
P. 97
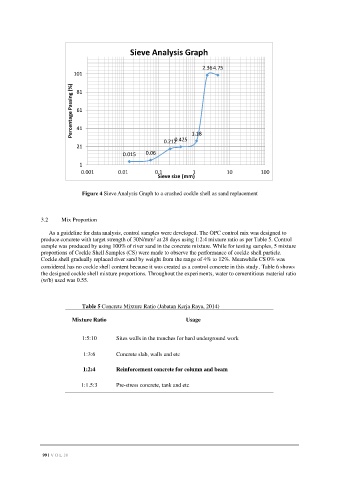
Sieve Analysis Graph

                                                                        2.36 4.75
                           101
                          Percentage Passing (%)  61
                            81


                            41
                                                           0.212 0.425  1.18
                            21
                                            0.015   0.06

                             1
                              0.001        0.01        0.1           1           10          100
                                                        Sieve size (mm)


                              Figure 4 Sieve Analysis Graph to a crushed cockle shell as sand replacement


               3.2     Mix Proportion

                  As a guideline for data analysis, control samples were developed. The OPC control mix was designed to
               produce concrete with target strength of 30N/mm  at 28 days using 1:2:4 mixture ratio as per Table 5. Control
                                                       2
               sample was produced by using 100% of river sand in the concrete mixture. While for testing samples, 5 mixture
               proportions of Cockle Shell Samples (CS) were made to observe the performance of cockle shell particle.
               Cockle shell gradually replaced river sand by weight from the range of 4% to 12%. Meanwhile CS 0% was
               considered has no cockle shell content because it was created as a control concrete in this study. Table 6 shows
               the designed cockle shell mixture proportions. Throughout the experiments, water to cementitious material ratio
               (w/b) used was 0.55.


                              Table 5 Concrete Mixture Ratio (Jabatan Kerja Raya, 2014)

                          Mixture Ratio                           Usage


                              1:5:10      Sites walls in the trenches for hard underground work


                              1:3:6       Concrete slab, walls and etc

                              1:2:4       Reinforcement concrete for column and beam

                              1:1.5:3     Pre-stress concrete, tank and etc


                99 | V O L 18